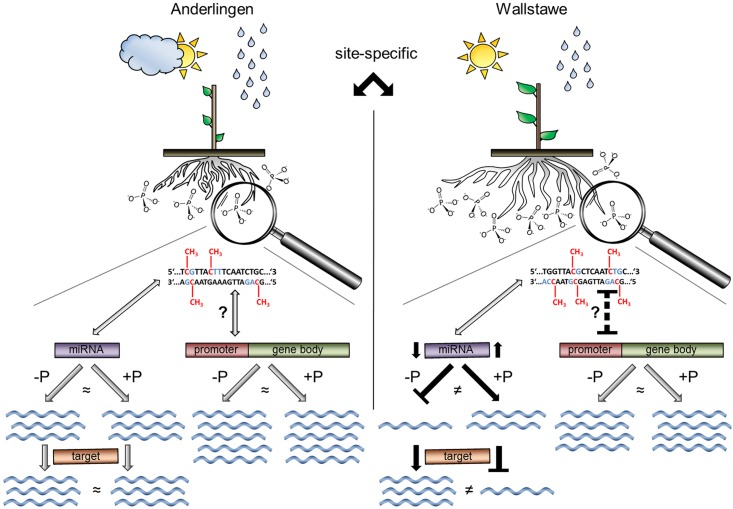
Fig 8. Schema of site-dependent differences in DNA methylation and their impact on plant establishment in clonal Populus trichocarpa.
Two different short rotation forestry sites (Anderlingen vs. Wallstawe) are shown; where the same Populus trichocarpa clone (cv. Muhle Larson) is grown. Growth conditions differ on the two sites, e.g. phosphate availability. DNA nucleotides are presented as T (thymine), G (guanine), A (adenine) and C (cytosine). Analysis of the DNA methylation pattern (red in DNA sequence) has revealed differentially methylated regions (DMRs) in all C contexts (blue in DNA sequence) between plants derived from Anderlingen or Wallstawe. A causal relationship between DNA methylation in coding regions and gene expression changes still remains unclear: In Anderlingen plants, the methylation rate in coding regions has no effect on gene expression (blue waves), independent from optimal (+P) or deficient (−P) phosphorus nutrition. In Wallstawe plants, methylation level in coding regions is negatively correlated with the gene expression (indicated by black dashed T-shaped bar). This observation is independent from phosphorus nutrition (indicated by neutral grey arrows). Though, DNA methylation has a different impact on DMR-regulated miRNAs and their targets: In Anderlingen plants, miRNA expression is not related to phosphorus supply or DNA methylation. Therefore, gene expression of their targets in both conditions is not different. In Wallstawe plants, miRNA expression depends on the phosphorus nutrition. −P leads to lower DMR-regulated miRNA expression (indicated by black arrows) and thereby to higher target gene expression. +P leads to a higher DMR-regulated miRNA expression and thereby to a lower target gene expression (indicated by a black arrow and T-shaped bar).

