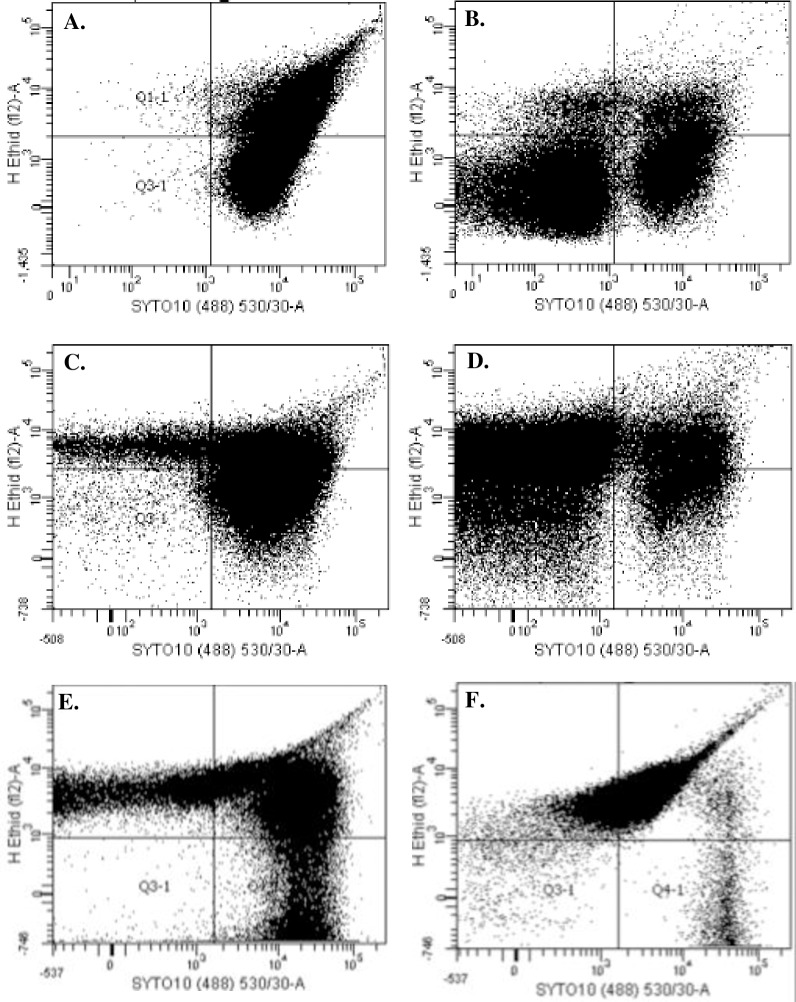
Fig 4. Flow cytometric analysis of biofilms exposed to 200 μA direct current (DC) for 24 hours, and controls.
S. aureus control (A) and DC exposure (B); S. epidermidis control (C) and DC exposure (D); and P. aeruginosa control (E) and DC exposure (F). Experiments were performed in triplicate for each organism; a representative graph is shown for each bacterium.

