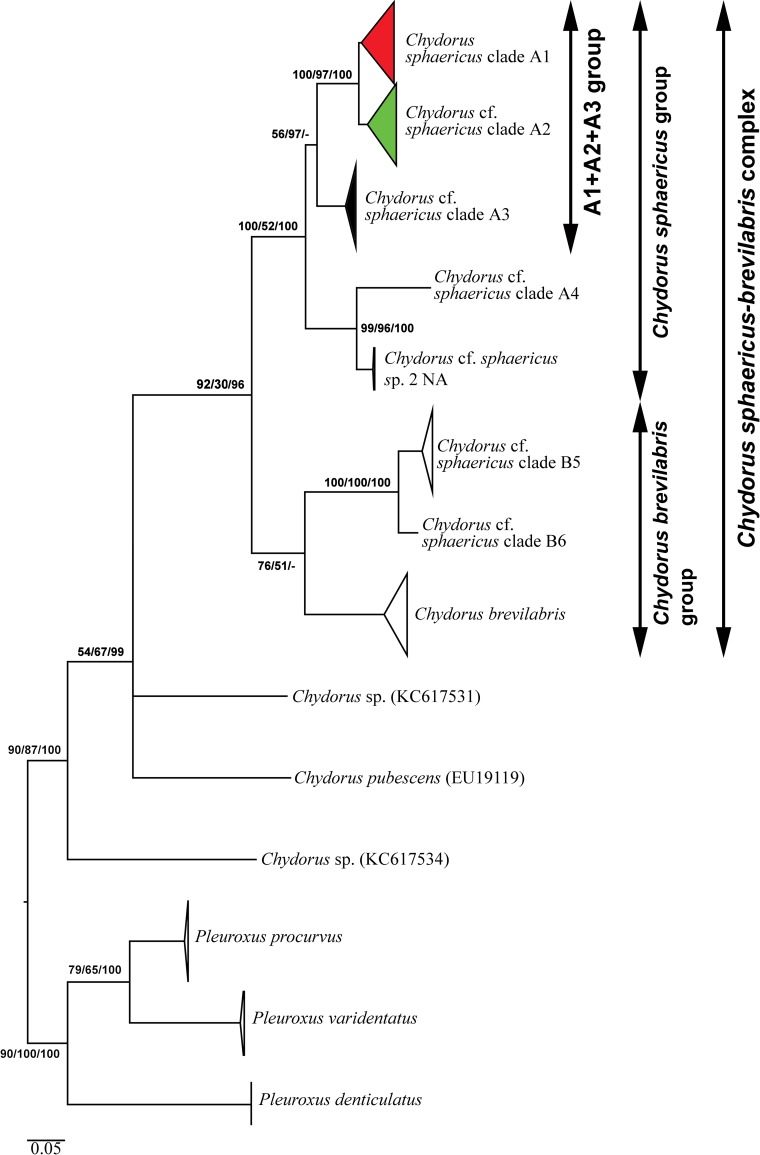
Fig 2. Maximum likelihood tree based on sequences of the mitochondrial cytochrome c oxidase subunit I (COI) gene representing the diversity among phylogroups of the genus Chydorus.
The support values of individual nodes are based on: Maximum likelihood (ML)/ Maximum Parsimony (MP) / Bayesian Inference (BI). Colors for main phylogroups correspond to those in Fig 1.

