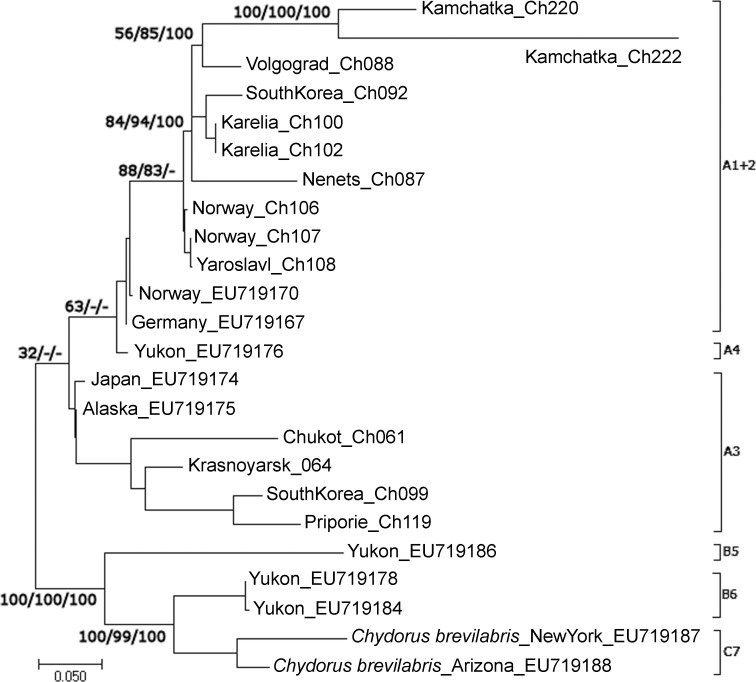
Fig 4. Maximum likehood tree based on sequences of nuclear rDNA internal transcribed spacer (ITS-2) gene representing the diversity among clades of the group A1+A2+A3 from the Chydorus sphaericus group.
The support values of individual nodes are based on different variants of phylogenetic analysis: ML / ME / BI.

