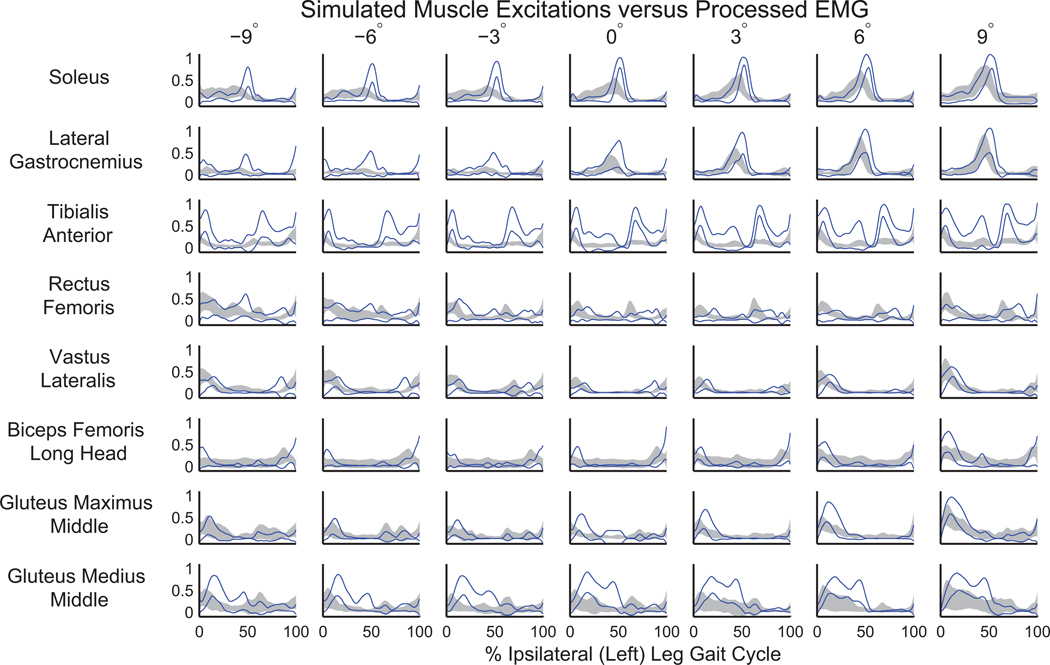
Figure 2.
Comparison of mean (±SD) processed electromyographic (EMG) signals (gray shaded area) with the similarly processed mean of computed muscle control excitations (±SD shown in solid blue). The relative timing and magnitude of excitations in the simulations compared well with EMG as slope varied.

