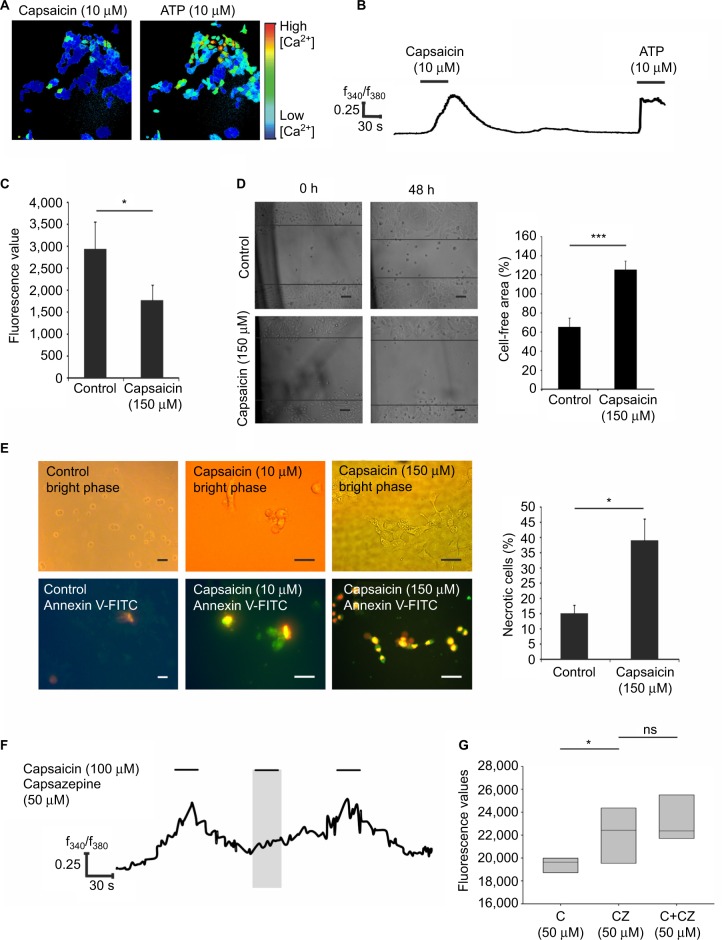
Figure 5.
Functional characterization of TRPV1 activation by capsaicin in SUM149PT cells.
Notes: (A) Representative image of SUM149PT cells stimulated with capsaicin (10 µM) in calcium imaging analysis. To ensure the viability of the cells, ATP (10 µM) was applied finally and served as a positive control. N > 3 with n = 12 measurements in six cell culture dishes with ~200 cells. (B) Activation of SUM149PT cells upon repetitive capsaicin application (10 µM). (C) Analysis of cell proliferation via CyQuant proliferation assay after capsaicin stimulation for 48 h (150 µM); n = 20. (D) Analyses of cell migration by scratch assay after capsaicin (150 µM) stimulation for 48 h. Bar chart showing statistical analysis of the area overgrown in scratch assay experiments; n = 3 assays. (E) Annexin V-FITC staining of SUM149PT cells stimulated by capsaicin (10 and 150 µM). Early apoptotic cells (Annexin V positive, PI negative) are shown in green; necrotic cells (Annexin V positive, PI positive) are shown in yellowish-red, and viable cells are shown in bright phase (Annexin V negative, PI negative). Bar chart showing statistical analysis of cells undergoing necrosis; n = 3 stains of five slices with ~300 cells. (F) Calcium signal upon application of capsaicin (100 µM) and capsaicin (100 µM) + capsazepin (50 µM); n = 6 cell culture dishes with ~200 cells. The shaded area represents the application of the antagonist capsazepin. (G) Analysis of the cell proliferation via CyQuant proliferation assay after capsaicin (50 µM) and capsaicin (50 µM) + capsazepin (50 µM) stimulation for 48 h; n = 10. *P<0.05, ***P<0.001. Scale bar = 10 µm.
Abbreviations: C, capsaicin; CZ, capsazepin; FITC, fluorescein isothiocyanate; PI, propidium iodide; F340/F380, ratio of the fluorescence intensities at 340 nm and 380 nm excitation; C, capsaicin; CZ, capsazepin; ATP, adenosine triphosphate; ns, not significant.

