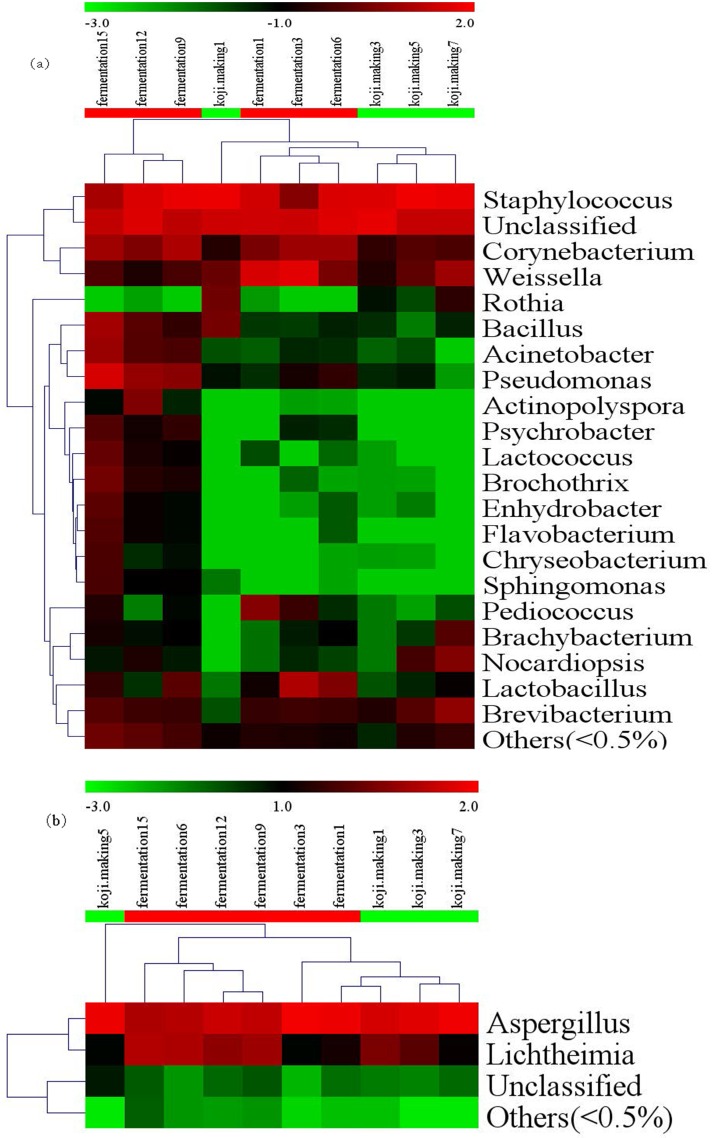
Fig 2. Heatmap and dendrogram of abundant bacterial (a) and fungal (b) genera present in the microbial community of 10 samples from koji making and fermentation.
The heatmap plot indicates the relative abundance of genera in different samples (variables clustered on the vertical axis). The phylogenetic tree was calculated using the neighbour-joining method. The colour intensity is proportional to the relative abundance of bacterial and fungal genera.

