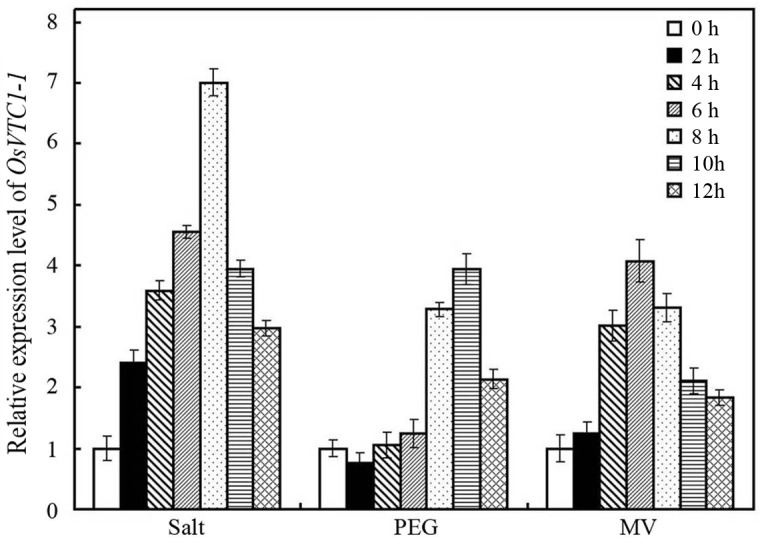
Fig 1. The expression of OsVTC1-1 in plant responses to abiotic stresses.
To examine the expression patterns of OsVTC1-1 in plant responses to salt, PEG or MV, the transcript level of OsVTC1-1 was analyzed by Q-PCR. After normalizing to internal control (Actin), the transcript level of OsVTC1-1 under control conditions (0 h) was assigned as 1, and this figure shows the expression level of OsVTC1-1 at others times relative to 0 h. The experiments were repeated three times.

