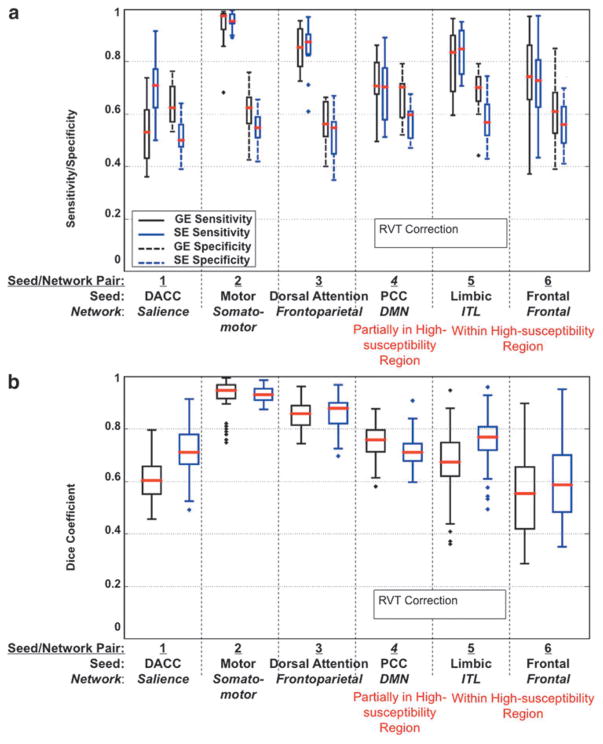
FIG. 11.
The effect of CRV correction on GE and SE functional connectivity measures. (a) Sensitivity and specificity plots; (b) Dice Coefficient plots representing spatial reliability between subjects. Results include only voxels with a statistically significant correlation, p ≤ 0.05, to the seed. The plots are based on data for all subjects. Networks located in high-susceptibility regions are indicated in red.

