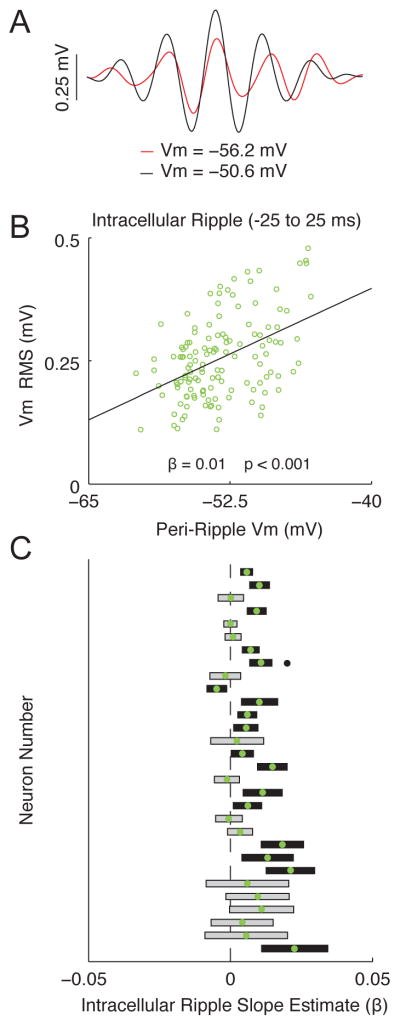
Figure 3. Membrane potential dependence of intracellular ripple oscillation amplitude.
(A) Average ripple-band Vm (intracellular ripple) from the most depolarized half (black) and hyperpolarized half (red) of ripples from a single neuron.
(B) Scatter plot showing relationship between peri-ripple Vm (± 25 ms average) and intracellular ripple RMS for all single ripples from the same neuron as in (A). Note that ripples occurring at more depolarized levels tend to be larger, giving rise to a positive slope estimate (β>0; p<0.001).
(C) Comparison of slope estimates (β) computed as in (B) across all 30 neurons, sorted by the number of ripples for each neuron. Neurons with the largest number of ripples are on top. Green dots mark slope estimates. Rectangles are the 95% confidence intervals. Black rectangles indicate slope estimates that are significantly different from 0 (grey otherwise). Black dot marks location of neuron used in (A–B). Note that the majority of neurons (26 of 30) tended to have larger intracellular ripples at more depolarized levels, as indicated by positive slope estimates (β > 0), which is statistically different (p<0.01) from the expected proportion of 0.5 using a two-sided binomial test.

