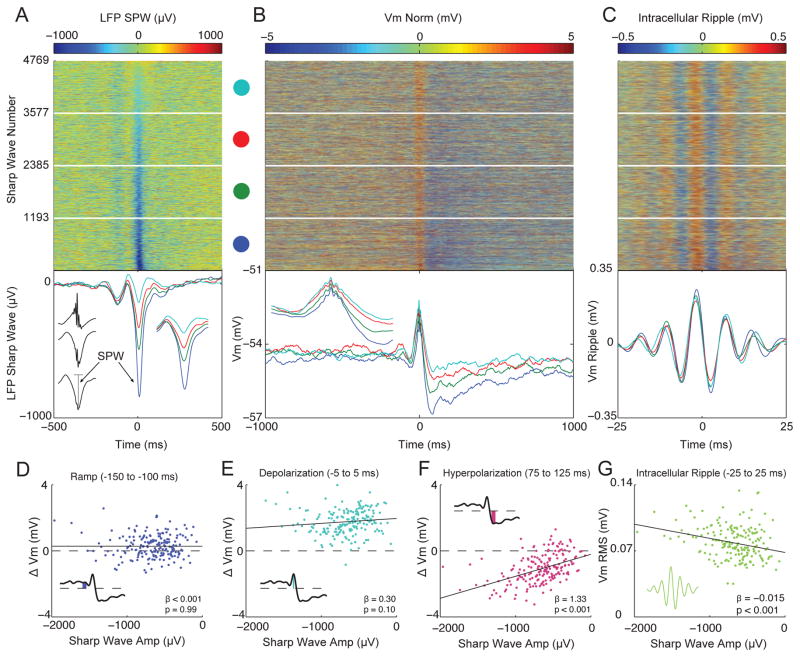
Figure 4. Membrane potential dynamics vary with sharp wave amplitude.
(A) Top: Ripple-triggered LFP from stratum radiatum, sorted by sharp wave amplitude for all 4769 ripples. Bottom: Quartile averages color coded according to dots above. The inset to the left shows the average LFP sharp wave (bottom trace) along with its amplitude (vertical grey line). The inset to the right shows a magnified view of the quartile averages (± 100 ms).
(B) Top: Subthreshold Vm sorted by sharp wave amplitude from (A). Each row is normalized to have 0 mean (Vm Norm). Quartile averages shown below. The inset shows a magnified view of the depolarization (± 100 ms). Note that larger sharp waves are associated with a larger post-ripple hyperpolarization, while the depolarization is relatively unaffected.
(C) Top: Ripple-band Vm sorted by sharp wave amplitude from (A). Quartile averages shown below.
(D) Scatter plot between LFP sharp wave amplitude and intracellular ramp amplitude. For D–G, to get an estimate of the component’s amplitude, the sharp wave sorted response matrices (from A–C) were divided into 190 blocked averages of 25 sharp waves each, and the amplitude of each component was computed as in Figures 2/3. The inset shows a schematic of how ramp amplitude was computed.
(E) Same as in D, but for the amplitude of the depolarization.
(F) Same as in D, but for the amplitude of the hyperpolarization.
(G) Same as in D, but for the RMS amplitude of intracellular ripples. Notice that only the hyperpolarization and intracellular ripple change systematically as a function of sharp wave amplitude, while the ramp and depolarization remain invariant.
See also Figure S3.

