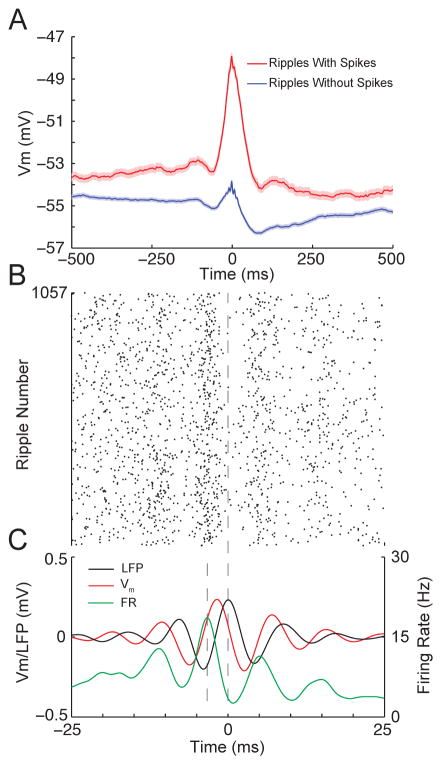
Figure 5. Large intracellular depolarizations bring neurons to spike threshold, while intracellular ripple oscillations control the precise spike timing.
(A) Averages of the subthreshold Vm for ripples where the neuron fired at least one action potential (red; N=1057) or did not fire (blue; N=3712). Shaded regions mark mean ± SEM. Note that for ripples with at least one spike, the Vm had a depolarization several times larger than the average depolarization for ripples with no spikes.
(B) Ripple-triggered raster plot of spike times from whole-cell recordings.
(C) Average LFP ripple (black), intracellular ripple (red), and firing rate (green). The firing rate was computed by smoothing spike times with a gaussian (σ=1 ms) and averaging across all ripples. Vertical dashed lines mark the time of the peak firing rate and peak LFP ripple oscillation. Note that the peak firing rate occurs near the trough of LFP ripple oscillation, when the slope of the intracellular ripple is near its maximum.
See also Figure S4.

