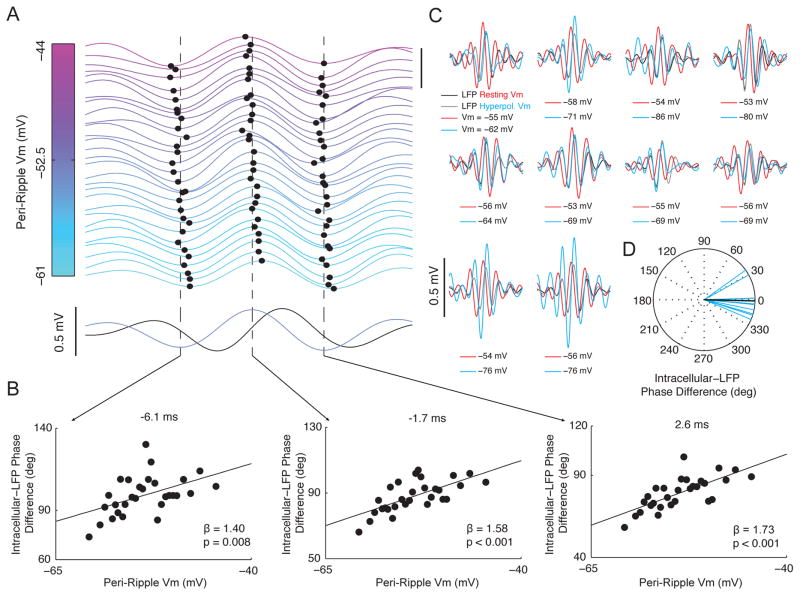
Figure 7. Intracellular ripple phase changes systematically with membrane potential.
(A) Top: Average intracellular ripple (from −8 to 12 ms) plotted as a function of Vm for the range of spontaneous Vm fluctuations. All ripples lacking intracellular action potentials were sorted by their peri-ripple Vm (±25 ms average), and 29 averages of 125 ripples each are displayed. Traces are separated by 0.1 mV (scale bar in upper right is 0.5 mV) and colored according to their peri-ripple Vm. The central peak and the preceding/subsequent troughs are marked by black dots for each trace. Vertical bars mark average time of preceding trough (−6.1 ms), central peak (−1.7 ms), and subsequent trough (2.6 ms). Note that hyperpolarized ripples (cyan) are phase delayed relative to depolarized ripples (pink). Bottom: Average LFP ripple (black) and intracellular ripple (light blue).
(B) Intracellular-LFP ripple phase difference plotted as a function of Vm for traces in (A).
(C) Average intracellular (red) and LFP (black) ripple at resting Vm, along with the intracellular (cyan) and LFP (grey) ripple with hyperpolarizing current injection (N=10 neurons). Scale bar marks 0.5 mV. Note that the central peak of intracellular ripples occurring under hyperpolarizing current injection (cyan) nearly aligns with LFP ripples (black/gray).
(D) Each neuron’s Intracellular-LFP ripple phase difference (at time 0) for intracellular ripples during hyperpolarizing current injection (cyan; N=10 neurons). The average is shown in black.
See also Figure S6.

