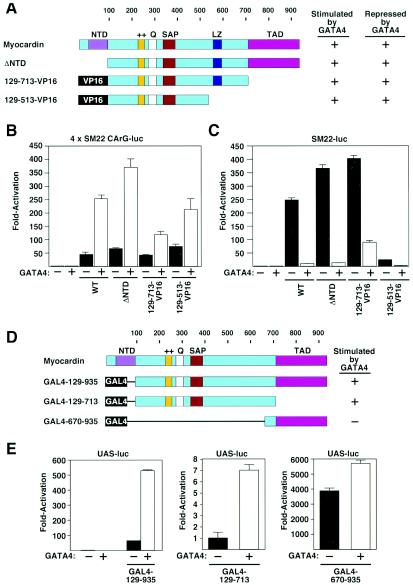
FIG. 3.
Mapping the region of myocardin that responds to GATA. (A) Schematic diagrams of myocardin mutants. The potential of each protein to be stimulated by GATA4 on the 4xSM22-CArG promoter or repressed by GATA4 on the SM22 promoter is indicated. (B and C) COS cells were transiently transfected with the luciferase reporter plasmids shown above each panel and expression vectors encoding GATA4 (100 ng) and myocardin or myocardin mutants (100 ng) shown in panel A, as indicated. Luciferase activity was assayed and is expressed as fold activation above the level of expression of the reporter gene alone. (D) Schematic diagrams of GAL4-myocardin fusion proteins. The potential of each protein to be stimulated by GATA4 is indicated. (E) COS cells were transiently transfected with an upstream activation sequence-luciferase reporter plasmid and expression vectors encoding GAL4-myocardin fusion proteins (100 ng) shown in panel D with and without a GATA4 expression vector (100 ng), as indicated. Luciferase activity was assayed and is expressed as fold activation above the level of expression of the reporter gene alone.

