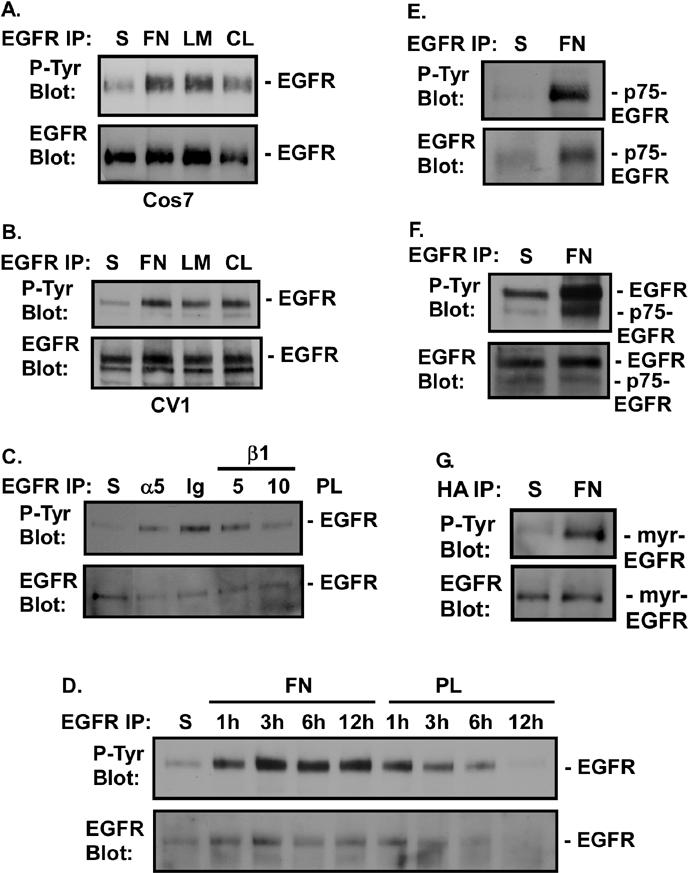
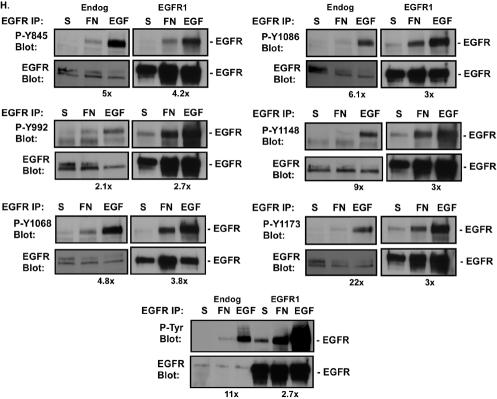
FIG. 1.

FN-induced phosphorylation of EGFR. (A and B) Cos7 (A) or CV1 (B) cells were either held in suspension (S) or plated on FN, laminin (LM), or collagen I (CL) for 20 min. (C) CV1 cells were either held in suspension or treated with 10 μg of immunoglobulin G/ml (Ig), 10 μg of an anti-α5 antibody/ml (α5), or 5 or 10 μg of an anti-β1 integrin antibody/ml (β1) for 1 h. Cells were plated on polylysine (PL) and incubated for 30 min. (D) CV1 cells were either held in suspension or plated on FN or polylysine for the indicated times. EGFR phosphorylation in EGFR immunoprecipitates was measured by immunoblotting with an anti-phosphotyrosine monoclonal antibody (P-Tyr Blot). Total levels of EGFR in the immunoprecipitates were analyzed by immunoblotting with an anti-EGFR antibody (EGFR Blot). (E through G) Rat1 cells stably expressing the p75-EGFR chimera (the p75 extracellular and transmembrane domains fused to the cytoplasmic domain of EGFR) (E) or Cos7 cells transiently transfected with either 0.5 μg of pML-p75.EGFR.F2.HA, encoding the p75-EGFR chimera (F), or 0.1 μg of pML-EGFR-F1-HA, encoding a myristoylated EGFR cytoplasmic domain (myr-EGFR) (G), were either held in suspension or plated on FN for 20 min. Levels of tyrosine phosphorylation of the chimeras were analyzed by immunoblotting of EGFR or HA immunoprecipitates with anti-phosphotyrosine antibodies. Total levels of p75-EGFR or myr-EGFR in the immunoprecipitates were measured by immunoblotting with anti-EGFR antibodies. (Note that in panel F, endogenous levels of EGFR are also shown.) (H) Control cells expressing endogenous levels of EGFR (Endog) or EGFR-overexpressing cells (EGFR1) were either placed in suspension, plated on FN for 30 min, or stimulated with 2 ng of EGF/ml for 5 min. EGFR was immunoprecipitated from cell extracts, and total levels of tyrosine phosphorylation (P-Tyr Blot) or phosphorylation of one of six different tyrosines (Y845, Y992, Y1068, Y1086, Y1148, or Y1173) was monitored by immunoblotting with anti-phospho-EGFR antibodies. Total levels of EGFR in the immunoprecipitates were analyzed by immunoblotting with an anti-EGFR antibody. Digital images were quantified by using ScanImage software (Scion Corp). The fold difference in tyrosine phosphorylation between FN- and EGF-treated cells is given below each set of panels.

