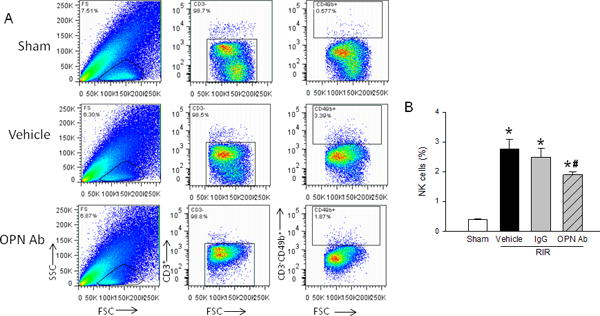
Figure 7. Neutralization of OPN reduces NK cell infiltration.

Renal tissue from sham, vehicle, IgG control, and anti-OPN Ab treated mice were collected 24 h after RIR. Cells were isolated and stained for CD3−CD49b+ NK cells. (A) Representative flow images with gating strategies shown. (B) NK cell frequencies expressed as a percentage of CD3− leukocytes. Data are expressed as mean ± SEM (n=8–10 animals/group) and compared by one-way ANOVA by SNK method. *p<0.05 vs. sham; #p<0.05 vs. vehicle; ψp<0.05 vs. IgG. NK, natural killer; OPN, osteopontin.
