Figure 1.

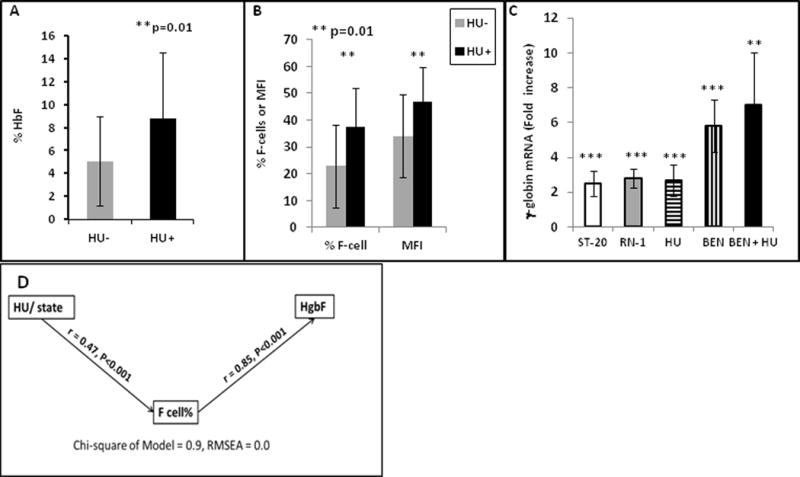
A–B. Mean levels of HbF, F-cells, or MFI in sickle cell patients who were taking HU (dark bars) were significantly higher in treated than in untreated patients. C. Fetal (γ)-globin mRNA in erythroid progenitors cultured from sickle cell patients is significantly increased (*) with added therapeutics compared to untreated controls from the same patient, from 2.5 to 2.8-fold with ST20, RN-1, or HU, 5.8-fold with BEN (p< 0.001), and 7-fold with BEN + HU (n=10, p = 0.011). Standard deviation is shown by the vertical bars. D. Diagram of the Pathway analysis, demonstrating that the main effect of Hydroxyurea (HU) is due to increases in % F-cells, which in turn contribute to total HbF.
