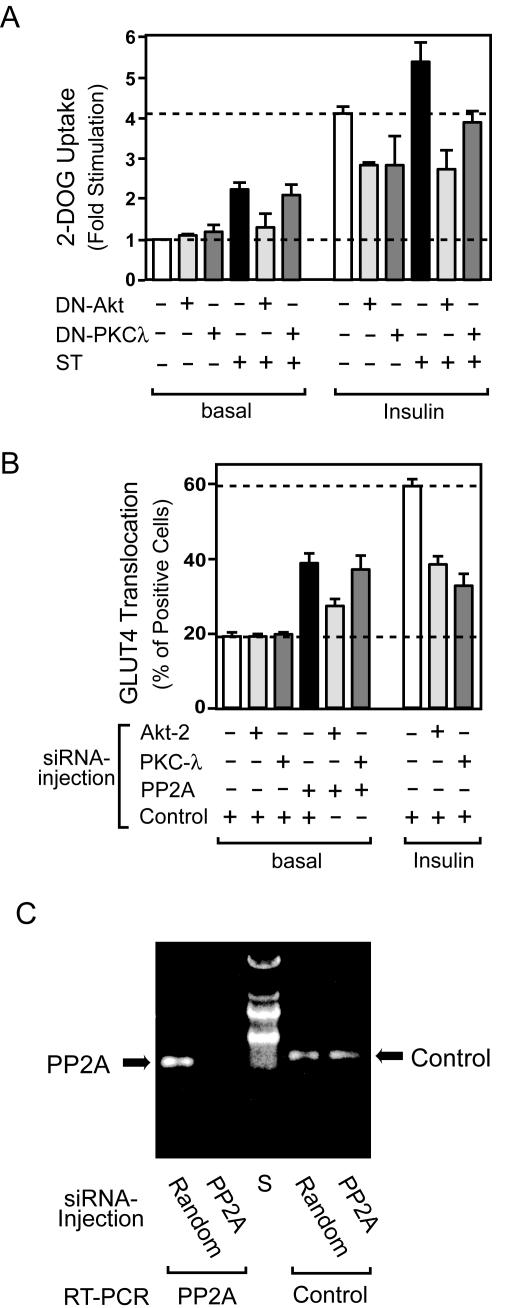
FIG. 10.
The stimulatory effects of PP2A inhibition on glucose (2-DOG) uptake and GLUT4 translocation are dependent on Akt but not on PKC λ. (A) 3T3-L1 adipocytes infected with either control virus or adenovirus encoding DN-Akt, DN-PKC λ, or small t antigen (at MOIs of 50, 80, and 40, respectively) were stimulated with insulin (100 ng/ml) for 30 min. Glucose uptake was measured as described in Materials and Methods. Data are presented as the increase (n-fold) in glucose uptake compared to unstimulated control cells and represent the mean ± SE of results from three independent experiments. (B) 3T3-L1 adipocytes on coverslips were microinjected with each siRNA mixture, which targets Akt2 and negative control (NC), PKC λ and NC, PP2A and NC, Akt2 and PP2A, PKC λ and PP2A, or NC alone. The final concentration of siRNA mixtures is adjusted to 5 μM with or without control siRNA. Cells were starved and stimulated with insulin for 20 min. GLUT4 staining was performed as described in Materials and Methods. Data shown are the mean ± SE of results from three or four independent experiments. (C) The efficiency of siRNA against PP2A during the microinjection experiments was confirmed by reverse transcription (RT)-PCR. Approximately 200 mature 3T3-L1 adipocytes in 3 μl of complete medium were spotted on col-lagen-coated coverslips and incubated for 15 min in a humidified chamber, and the chamber was then filled with complete medium. The next day, all of the cells were microinjected with PP2A or negative control (Random) siRNA. Forty-eight hours after microinjection, cells were scraped, and total RNA was purified with an RNeasy minikit (QIAGEN). The RT-PCR was performed with a PP2A-specific or GRK2 (Control) primer set by using a one-step RT-PCR kit (QIAGEN). A representative image from two independent experiments is shown. S, size marker.

