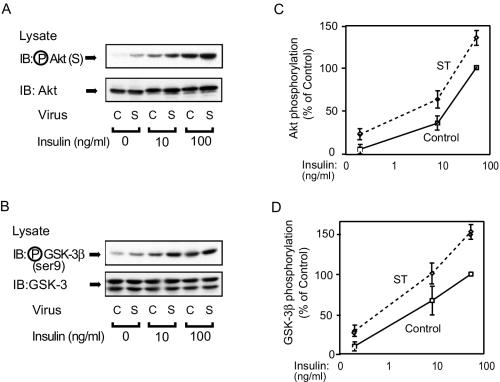
FIG. 3.
Akt and GSK-3β phosphorylation is enhanced in small-t-antigen-expressing cells. (A) 3T3-L1 adipocytes were infected with either control virus (C) or small-t-antigen-encoding adenovirus (S). Whole-cell lysates were prepared and analyzed by Western blotting with phospho-specific Akt antibody (upper panel) or anti-Akt antibody (lower panel). (B) The lysates shown in panel A were analyzed by Western blotting with phospho-specific GSK-3β antibody (upper panel) or anti-GSK-3β antibody (lower panel). (C and D) Data are presented as the percentage of Akt or GSK-3β phosphorylation levels compared with that seen with maximally stimulated control cells and represent the mean ± SE of results from three independent experiments.

