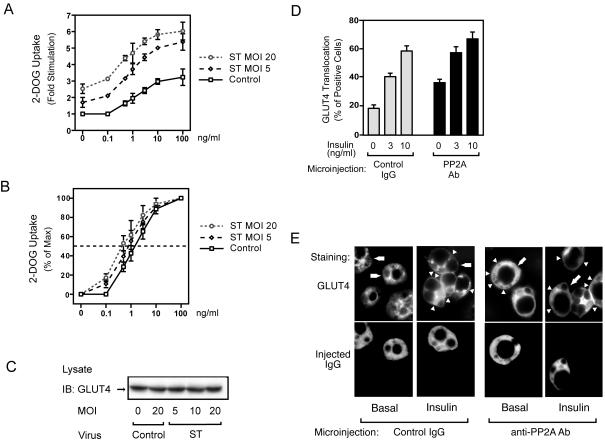
FIG. 8.
Glucose uptake is enhanced in small-t-antigen-expressing 3T3-L1 adipocytes. (A) 3T3-L1 adipocytes were infected with either control virus or small-t-antigen-encoding adenovirus (ST) at the indicated MOI and stimulated with insulin for 30 min. Glucose (2-DOG) uptake was measured as described in Materials and Methods. Data are presented as the increase (n-fold) in glucose uptake compared to that of unstimulated control cells and represent the mean ± SE of results from three independent experiments. (B) Data are presented as the percentage of the maximal response. (C) The expression of GLUT4 protein was unchanged by virus infection. 3T3-L1 adipocytes were infected with either control virus or small-t-antigen-encoding adenovirus (ST) at the indicated MOI. Whole-cell lysates were prepared and analyzed by Western blotting using anti-GLUT4 antibody. (D) 3T3-L1 adipocytes on coverslips were microinjected with anti-PP2A antibody or with sheep IgG as a control. Cells were starved and stimulated with insulin for 20 min. GLUT4 staining was performed as described in Materials and Methods. Data are presented as the percentage of cells positive for GLUT4 translocation, calculated by counting at least 100 cells, and represent the mean ± SE of results from three independent experiments. (E) Representative images of cells depicting GLUT4 staining from the experiment described for panel D. Open triangles indicate the GLUT4 ring, the thin line at cell edges, scored as positive. Lower panels show the injected cells, and the open arrows in the upper panels point to these injected cells.

