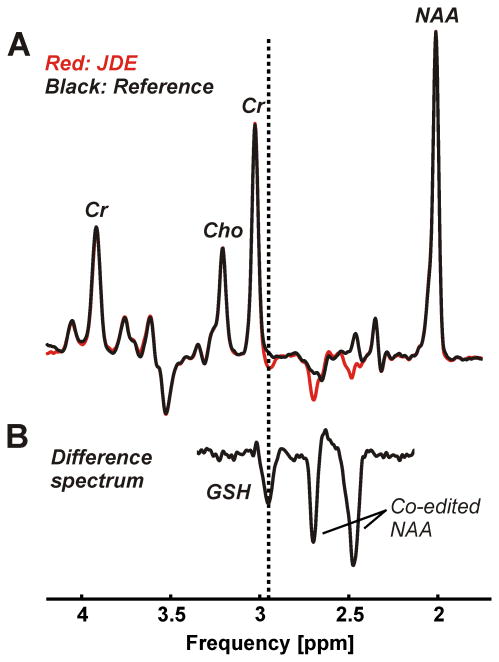
Figure 2.
JDE of GSH consisting of an edited condition (A, red) and a non-inverted reference (A, black) was performed using a semi-LASER sequence (voxel size 3×3×3 cm3, TR 3 s, TE 72 ms, 64 averages per JDE condition, acquisition time 7 min). The difference spectrum (B, scaling factor 3.3) exhibits expected co-edited NAA at 2.49 and 2.67 ppm and allows the isolation of the GSH CH2 signal of the cysteine moiety at 2.95 ppm (dotted vertical line).

