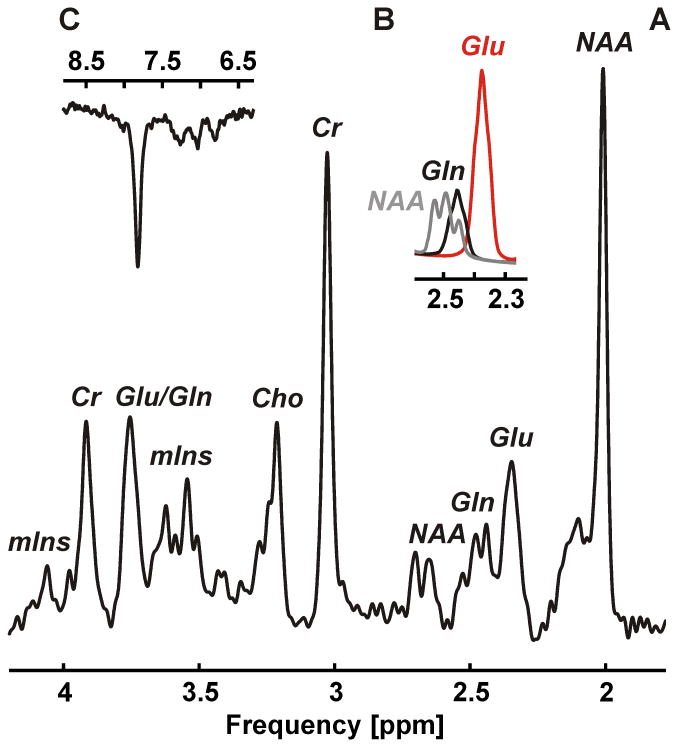
Figure 4.
1H MRS of target metabolites glutamate and glutamine along with additional metabolites choline, myo-inositol, NAA, creatine, ascorbate, aspartate, scyllo-inositol, and taurine measured with STEAM (A, voxel size 2×2×2 cm3, TR 3 s, TE 10 ms, mixing time 50 ms, 96 averages, acquisition time 5 min). The 4CH2 group of glutamate at 2.34/2.35 ppm could clearly be separated from both the 4CH2 group of glutamine at 2.43/2.46 ppm and the 3CH2 group of NAA at 2.49 ppm (B). The overall spectral quality supports the observation of down-field resonances, for instance, the phenylalanine peak at 7.37 ppm (C).

