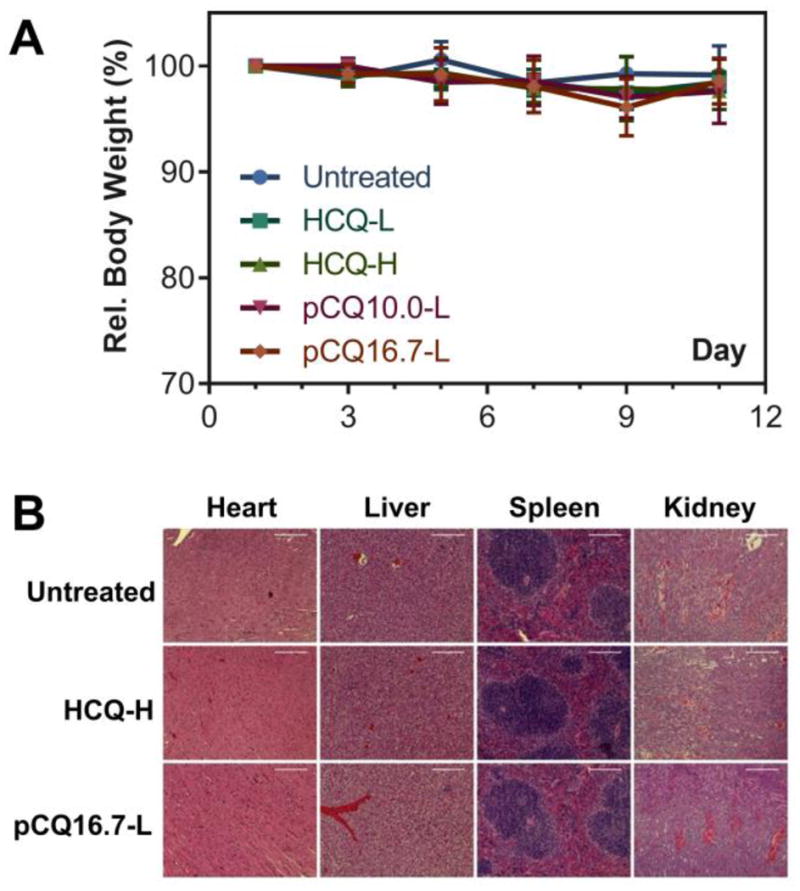
Figure 10.

Toxicity evaluation of pCQ in vivo. (A) Relative body weight. Results shown as % body weight relative to the body weight on day 0. (B) H&E staining of major organs in different treatment groups (heart 20×, liver 20×, spleen 20×, kidney 10×).
