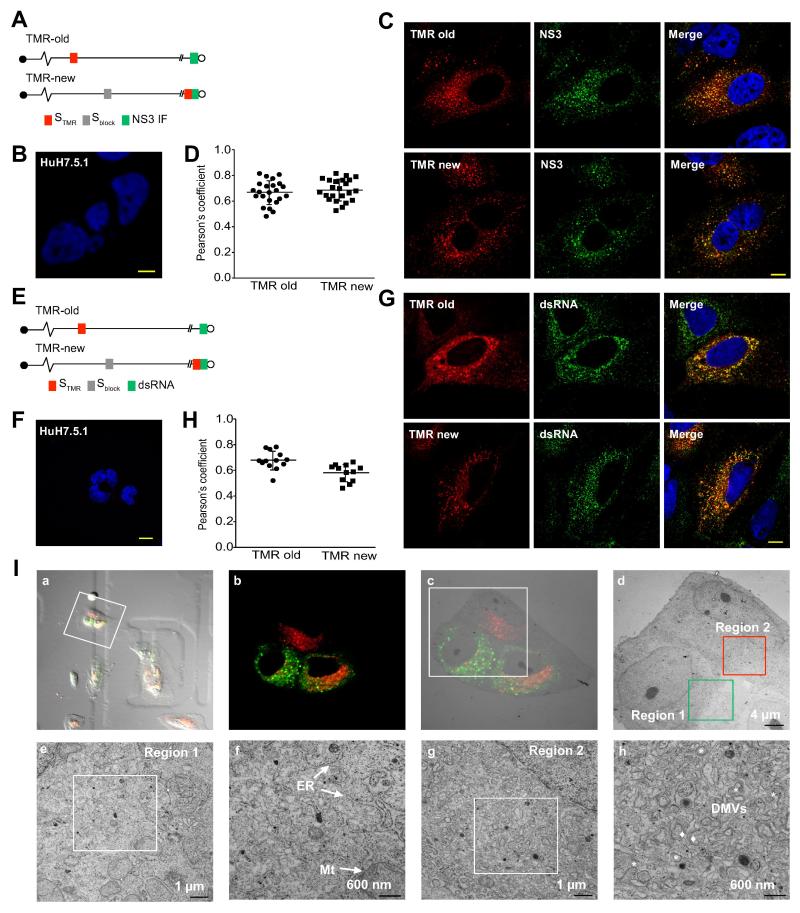
Figure 3. Both ‘old’ and ‘new’ NS5A foci contain other components of the HCV replication complex.
(A). Schematic of experimental design. ‘Old’ NS5A in SGR-JFH1(NS5A/SNAP) subgenomic replicon cells was visualized with STMR labeling followed by a 24 hr chase (top), while ‘new’ NS5A was visualized by first blocking unlabeled NS5A by nonfluorescent Sblock followed by a 16 hr chase and labeling with STMR (bottom). Cells were then fixed and immunostained for NS3.
(B). Huh7.5.1 cells were fixed and immunostatined for NS3. Nuclei counterstained with DAPI. Scale bar, 10 μm.
(C). Representative images of cells labeled as described above. Scale bar, 10 μm.
(D). Quantitation of colocalization between STMR-labeled NS5A and NS3. Each point denotes the Pearson’s coefficient calculated from a single cell. Summary mean±SD values are indicated.
(E). Schematic of experimental design. Cells infected with JFH1(NS5A-SNAP) full length virus was labeled for “old” (top) and “new” (bottom) NS5A as in panels A. Cells were then fixed and immunostained for dsRNA.
(F). Huh7.5.1 cells were fixed and immunostatined for dsRNA. Nuclei counterstained with DAPI. Scale bar, 10 μm.
(G). Representative images of cells labeled as described above. Scale bar, 10 μm.
(H). Quantitation of colocalization between STMR-labeled NS5A and dsRNA. Each point denotes the Pearson’s coefficient calculated from a single cell. Summary mean±SD values are indicated.
(I). Correlative light-electron microscopy of SGR-JFH1(NS5A/SNAP) subgenomic replicon cells. Live replicon cells were stained with STMR (for old foci) and S505 (for new foci) before acquisition of fluorescence and DIC images followed by immediate processing for EM. (a) Merged DIC/epifluorescence image of live cells on gridded coverslips. (b) Confocal fluorescent image of cells of interest. (c) Merged EM and fluorescence microscopy images. (d) Low magnification electron micrograph depicting regions of interest containing predominantly ‘new’ NS5A foci (region 1) or ‘old’ NS5A foci (region 2). (e-f) higher magnification images of region 1 in panel d. (g-h) higher magnification images of region 2 in panel d. ER, endoplasmic reticulum; Mt, mitochondria; DMVs, double membrane vesicles. Asterisks indicate DMVs; diamonds indicate multimembrane vesicles (MMVs).

