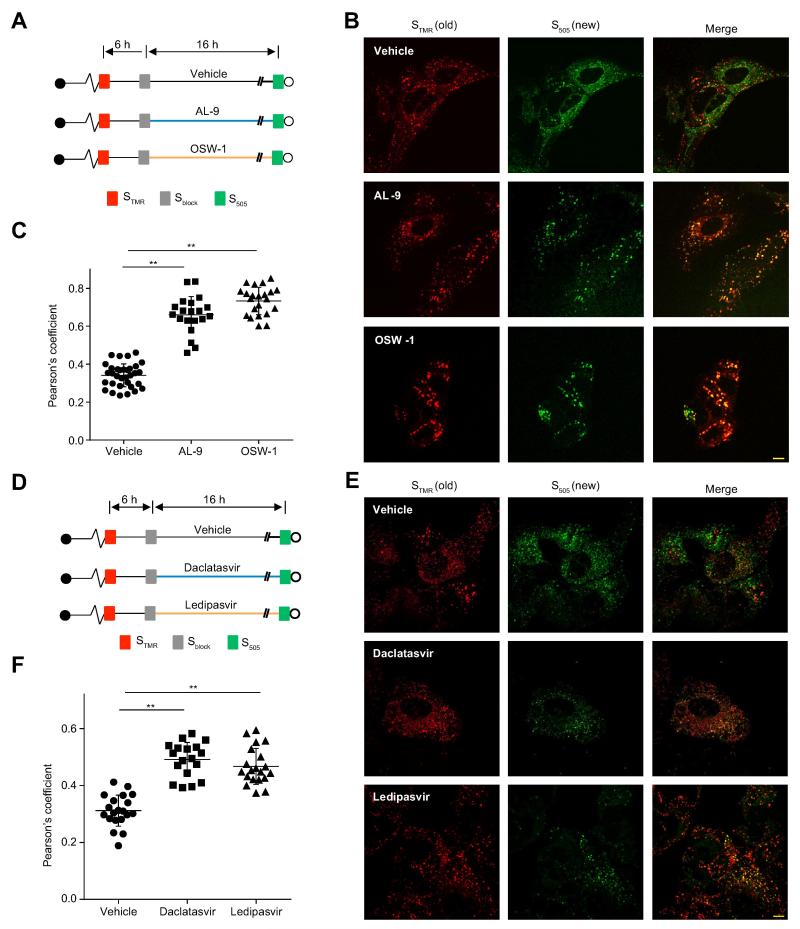
Figure 4. PI4KA, OSBP and NS5A are required to initiate new NS5A foci.
(A). Schematic of experimental design. SGR-JFH1 (NS5A/SNAP) subgenomic replicon cells were pulse labeled with STMR and treated with Sblock 6 hr later. Cells were then incubated with vehicle, AL-9 (4 μM), or OSW-1 (30 nM) for another 16 hr before newly synthesized NS5A was labeled with S505.
(B). Representative live-cell images of cells labeled as described above. Scale bar, 10μm.
(C). Quantitation of colocalization between STMR-labeled (old) and S505-labeled (new) NS5A. Each point denotes the Pearson’s coefficient calculated from a single cell. Summary mean±SD values representative of 3 independent experiments are indicated. ** p<0.001 versus vehicle.
(D). Schematic of experimental design. SGR-JFH1 (NS5A/SNAP) subgenomic replicon cells were pulse labeled with STMR and treated with Sblock 6 hr later. Cells were then incubated with vehicle, daclatasvir (100pM), or ledipasvir (100 nM) for another 16 hr before newly synthesized NS5A was labeled with S505.
(E). Representative live-cell images of cells labeled as described above. Scale bar, 10 μm.
(F). Quantitation of colocalization between STMR-labeled (old) and S505-labeled (new) NS5A. Each point denotes the Pearson’s coefficient calculated from a single cell. Summary mean±SD values representative of 3 independent experiments are indicated. ** p<0.001 versus vehicle.

