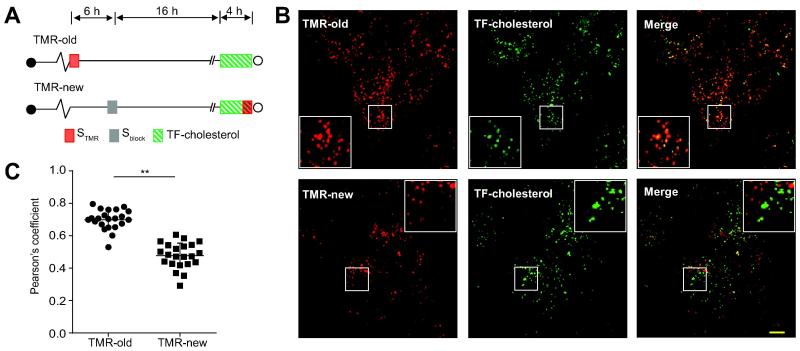
Figure 5. Preferential trafficking of a cholesterol analog to ‘old’ NS5A foci.
(A). Schematic of experimental design. SGR-JFH1(NS5A/SNAP) subgenomic replicon cells were either labeled with STMR (for old foci) or treated first with Sblock and 16 hr later with STMR (for new foci) immediately before imaging. 4μM fluorescent TopFluor-cholesterol (TF-cholesterol) was added 4 hr before imaging.
(B). Representative live-cell images. Scale bar, 10 μm.
(C). Quantitation of colocalization between STMR labeled NS5A and TF-cholesterol. Each point denotes the Pearson’s coefficient calculated from a single cell. Summary mean±SD values representative of 3 independent experiments are indicated. ** p<0.001.

