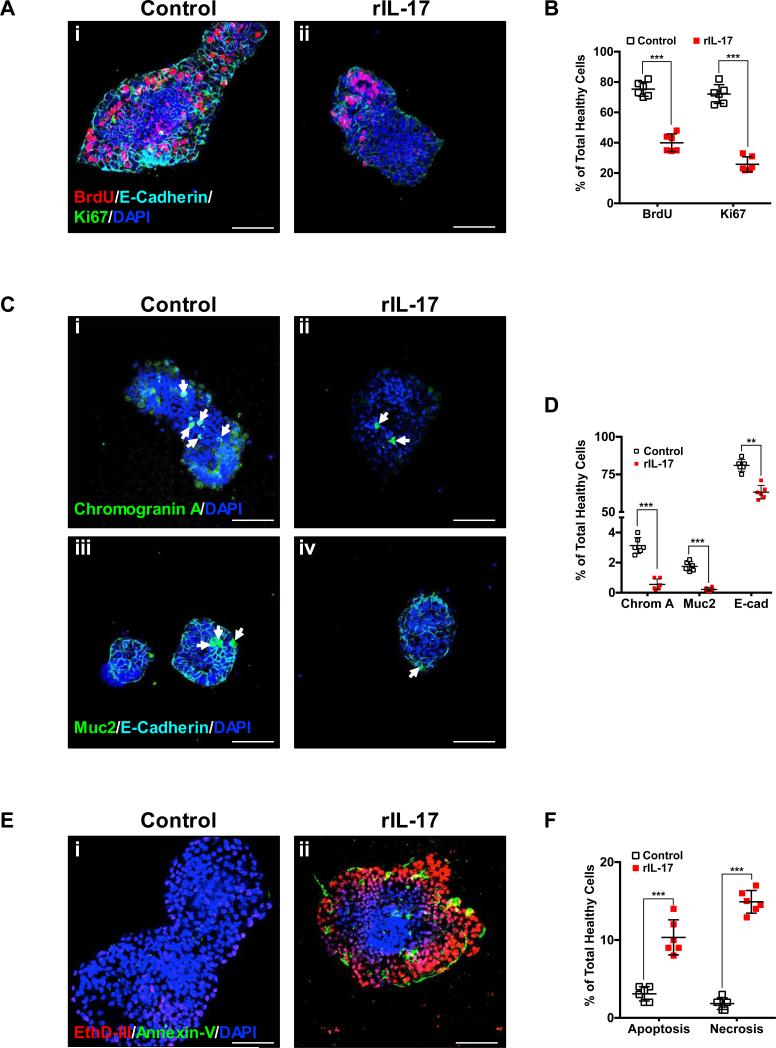
Fig. 4. IL-17 is detrimental to ISC homeostasis by inhibiting cell proliferation and differentiation and leading to apoptosis/necrosis.
The effects of the main cytokine released by Th17 cells (i.e. IL-17) on ISC biology was evaluated using enteroids generated from mouse ileum ISCs and exposed to recombinant IL-17 (rIL-17, 100 ng/mL for 6 h). Cell proliferation (A and B), cell differentiation (C and D) and apoptosis/necrosis (E and F) were assessed as described in the methods section. A, cell proliferation was evaluated in control and rIL-17 exposed enteroids using incorporation of BrdU label as well as expression of the proliferation marker Ki67. Representative confocal microscopy images of control (i) and rIL-17 treated (ii) enteroids are shown. C, cell differentiation was assessed by immunostaining for the enteroendocrine marker chromogranin A, the goblet cell marker muc-2 and the enterocyte marker E-cadherin. Representative confocal microscopy images of control (i and iii) and rIL-17 treated (ii and iv) enteroids are shown. Chromogranin A (i and ii) and muc-2 (iii and iv) positive cells are indicated by arrows. E, apoptosis and necrosis were assessed using the apoptotic cell marker Annexin V and necrotic cells were identified by their permeability to the nucleic acid probe ethidium homodimer III (EthD-III). Representative confocal microscopy images of control (i) and rIL-17 treated (ii) enteroids are shown. B, D and F, quantification of fluorescence intensity and cell number was performed using FIJI software and depicted as the average percentage of the total number of healthy cells. The overall effect of IL-17 on enteroids derived from ISCs is characterized by a significant decrease in cellular proliferation and differentiation as well as increased apoptosis/necrosis. All images depicted are representative of three separate experiments with at least five enteroids analyzed/group. Scale bar = 100μm. Data depicted is presented as mean ± SD. **P ≤ 0.01, ***P ≤ 0.001 determined by Student's t test.

