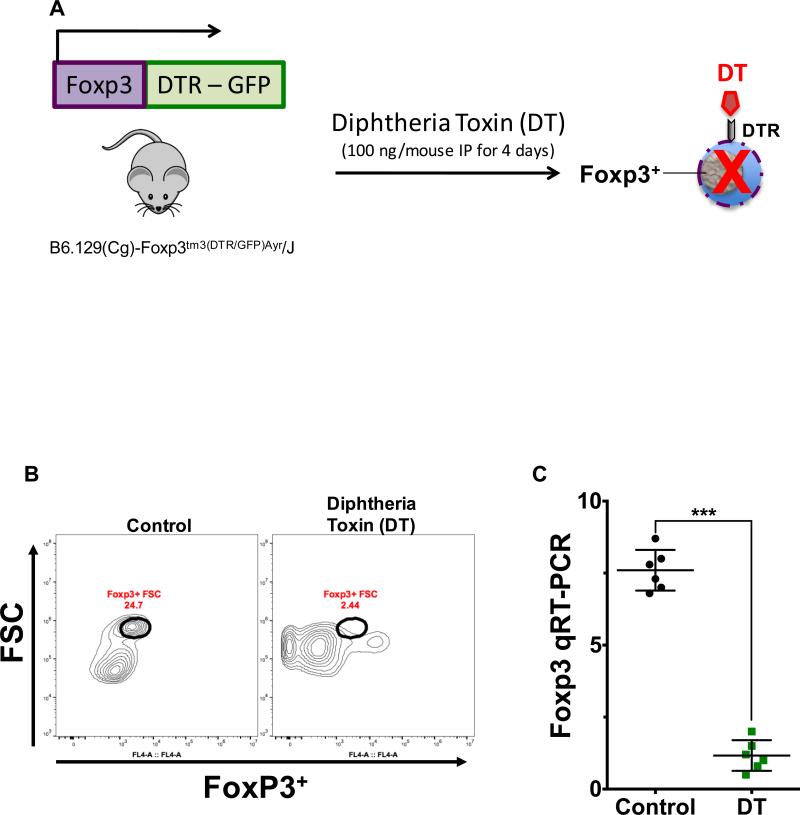
Fig. 5. Diphtheria toxin-induced depletion of Foxp3+ regulatory T cells.
A, schematic diagram depicts the experimental strategy as described in the methods section utilized for the depletion of Foxp3+ regulatory T cells (Tregs) in Foxp3DTR mice. Depletion of this cell population was confirmed by flow cytometry (B) and qRT-PCR (C). B, representative plot demonstrates the depletion of Tregs within the lamina propria of the terminal ileum obtained from Foxp3DTR mice that received diphtheria toxin (DT 100 ng/mouse IP, daily for 4 days). Flow cytometric analysis was performed on CD4+ T cells, which were magnetically isolated by positive selection using anti-CD4 beads. Control samples were obtained from mice that received saline. C, depletion of Tregs was further confirmed by qRT-PCR analysis of Foxp3 expression in the purified cell population obtained after magnetic isolation as described above. Data depicted in (C) is presented as mean ± SD and represents 3 independent experiments with at least 6 mice per group. ***P ≤ 0.0001 determined by Student's t test.

