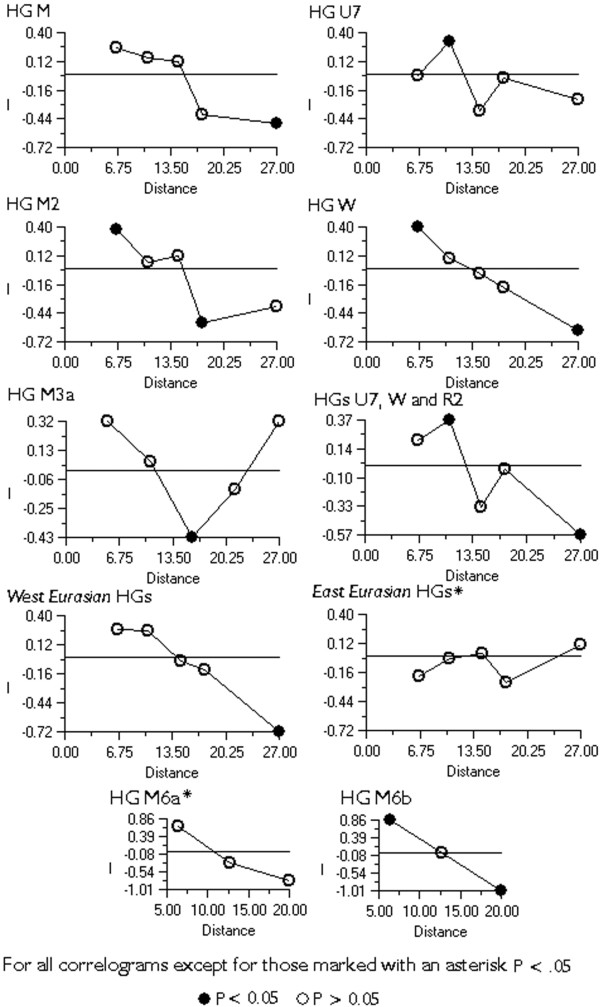
Figure 4.
Spatial Autocorrelation Analyses Correlograms of different haplogroups and haplogroup groupings frequencies in South Asia. In the case of haplogroup M3a some datasets had to be excluded because lack of resolution (see footenote for Table 3. for detailes). There was no significant cline in the frequencies of haplogroup R2. In the case of haplogroups M6a and M6b only the potential cline along the Bay of Bengal is investigated. Therefor the number of distance classes is reduced to three.

