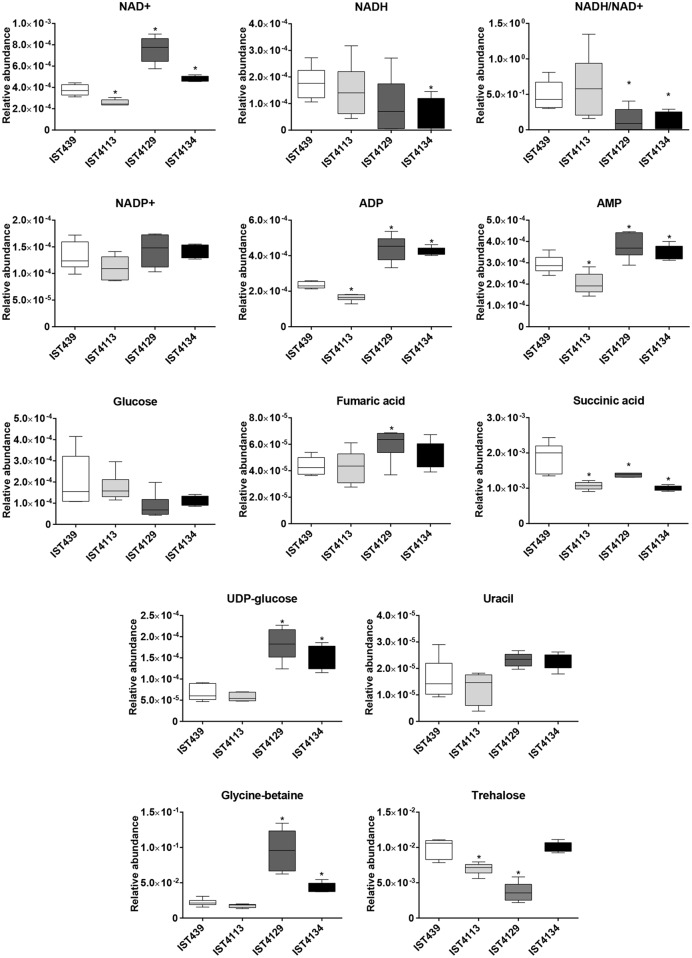
FIGURE 4.
Relative abundance of cofactors, metabolites involved in energy metabolism, organic acids, sugars, uracil and osmolytes, detected through comparative analysis of the endometabolomes of four B. cenocepacia sequential clonal variants retrieved from a CF patient chronically infected for 3.5 years. Each plot shows the variation of the relative abundance of a representative bin in all the spectra for each metabolite and B. cenocepacia isolate. Median values are represented by the line in the middle of the box with the ends showing the 25th and 75th percentiles. Upper and lower ends of the lines represent the maximum and minimum values respectively. ∗P < 0.05 when each late B. cenocepacia isolate was compared to the first isolate, IST439.

