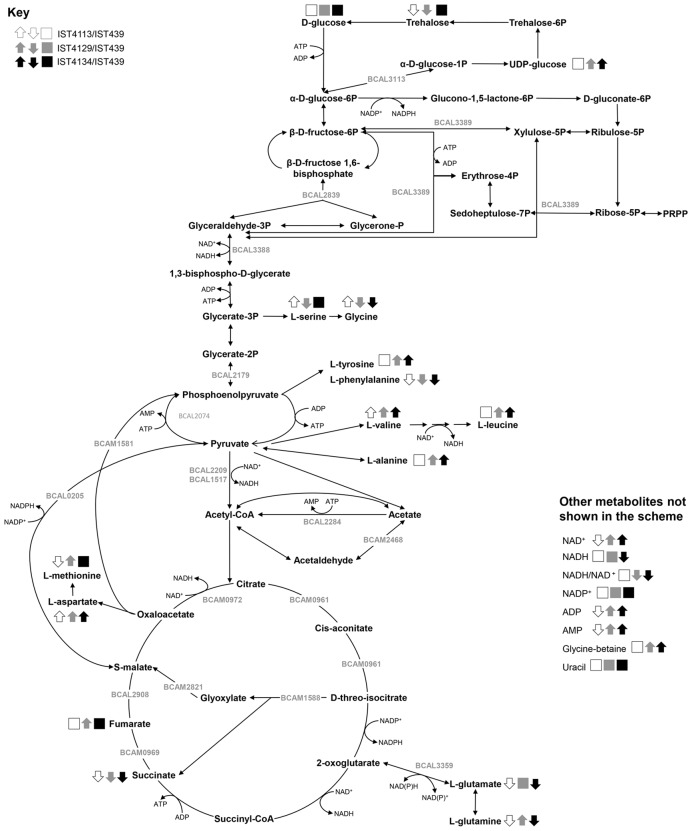
FIGURE 6.
Integrative and schematic overview of the metabolite changes detected in B. cenocepacia clonal isolates retrieved from the same CF patient. Statistically significant changes in the identified metabolites that were observed (white, gray, and black arrows) or not (white, gray, and black boxes) between the first isolate retrieved from the patient, IST439, and the late isolates IST4113 (white symbols), IST4129 (gray symbols) and IST4134 (black symbols) are shown (see key at the top left of the figure). The locus name of some of the genes and proteins with altered content in at least one of the late isolates compared with IST439 are also shown. This metabolic scheme was based on information gathered from KEGG PATHWAY Database (http://www.genome.jp/kegg/pathway.html), in BioCyc Database Collection (http://biocyc.org/) and in the metabolic reconstruction of B. cenocepacia J2315 (Bartell et al., 2014).

