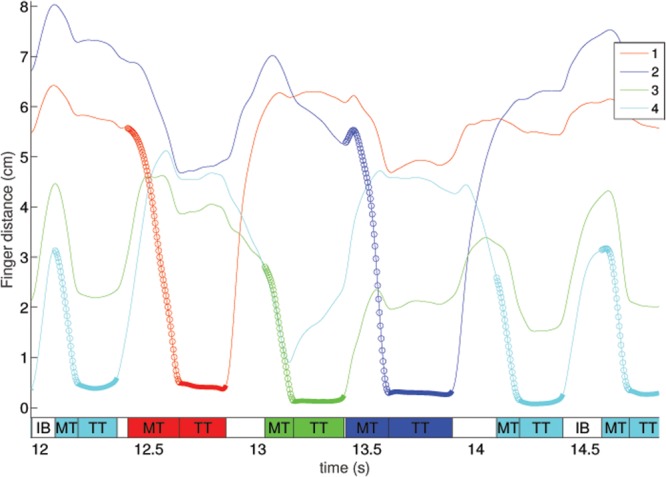
FIGURE 2.

An example of the decomposition of the movements into the various components, from a representative subject. The graph shows the distance between the thumb and the specified finger. The sections marked with circles are defined as the movement time (MT), and the sections marked with a thicker line are the touch times (TT). The colored rectangles at the bottom of the figure refer to the phases of the sequence acting along sequence execution. The time after the conclusion of the touch and the start of the next movement is defined as the inter-movement intervals, either within a sequence (IW – the unlabeled white rectangles at the bottom of the figure) or between a sequence (IB).
