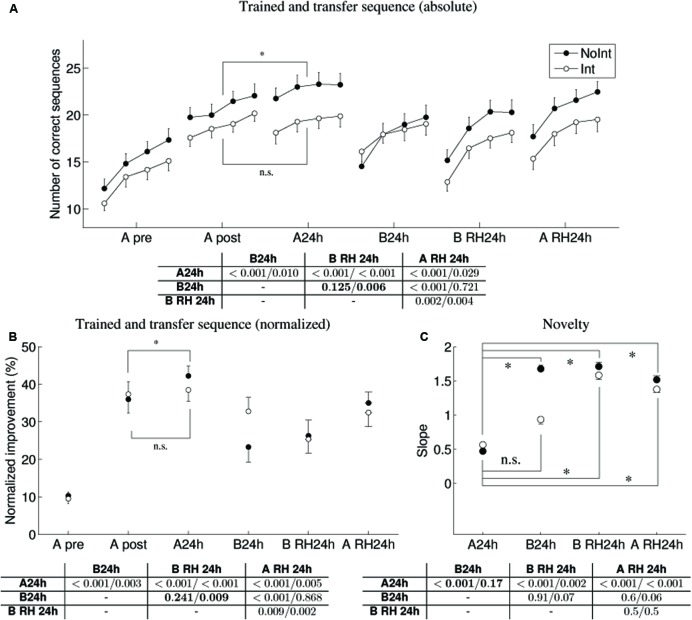
FIGURE 3.
Performance of trained and transfer sequences across the 24 h interval (pre-test, post-test, 24 h)for the NoInt and Int groups (A) Absolute performance (number of correct sequences), note that only the NoInt group shows significant overnight consolidation gains. (B) Normalized performance (relative to the first two tests of the pre-test, averaged across four performance trials) replicate the statistical conclusions as in (A). (C) Novelty effect (block-by-block changes in performance) for the transfer conditions. Data points are the mean slopes of linear regression lines, fitted to the four blocks of each test condition. Higher values indicate higher novelty. Tables of non-corrected pairwise comparisons between performances of NoInt/Int groups at 24 h post-training in three test conditions are shown for the absolute, normalized and novelty data, respectively. Note, that following interference training, at 24 h tests, the difference in the representation of sequence A and sequence B are evident both in the number of correct sequences and the novelty measures.

