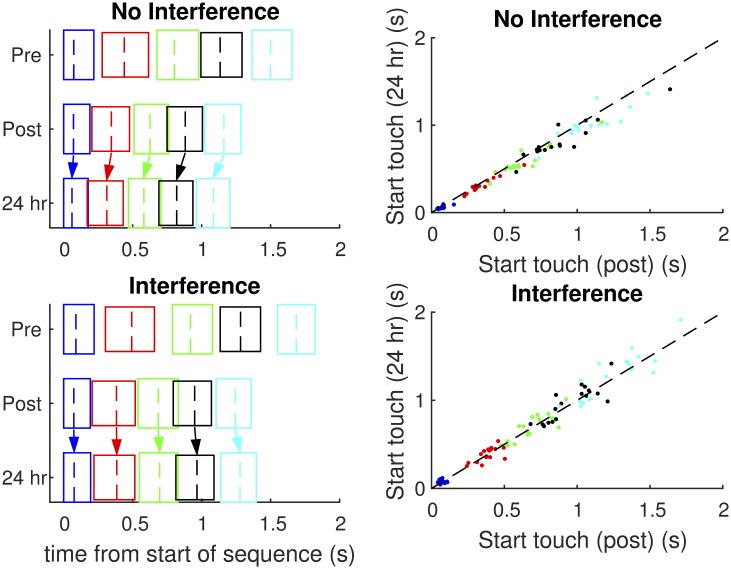
FIGURE 5.
Timing of the sequences. The left two panels show the mean times of the individual finger movements comprising the sequence for the two groups. The left solid vertical line of each box indicates the start of the movement, the dashed line indicates the start of the touch, and the right vertical line indicates the end of touch. Overlapping boxes indicate coarticulation (i.e., the later movement starts before the previous finger has finished touching). The scatterplots show the relationship between the mean touch times at post-test and 24-h retest, per individual finger. The dashed line represents the same time for both the tests. Note that for the NoInt group, nearly all the dots are below the dashed line (i.e., faster at 24 h retest), while this is not the case for the Int group.

