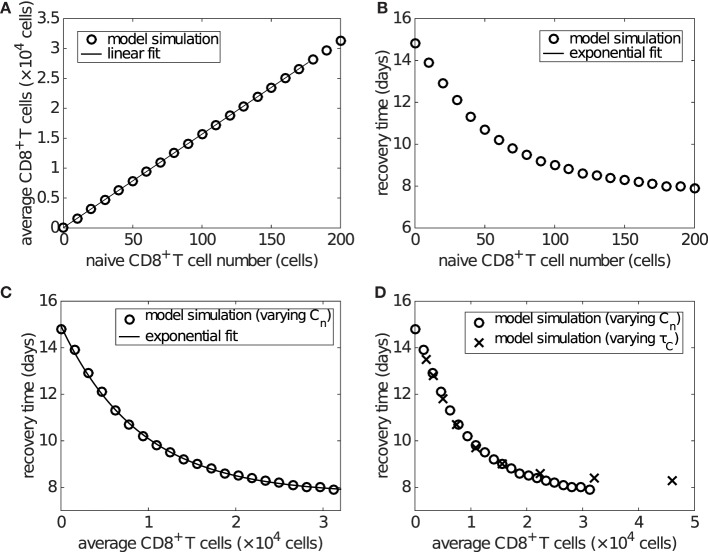
Figure 6.
The level of effector CD8+ T cells plays an important role in determining recovery time. Recovery time is defined to be the time when viral load falls to 1 EID50/ml. (A) shows that the average effector CD8+ T cell number over days 6–20 is linearly related to the naive CD8+ T cell number (i.e., Cn(0)). (B) shows that the recovery time is approximately exponentially related to the initial naive CD8+ T cell number. Combined, these results give (C), wherein an approximately exponential relationship is observed between the average CD8+ T cell number and recovery time, both of which are experimentally measurable. Note that the exponential/linear fits shown in the figures are not generated by the viral dynamics model but are used to indicate the trends (evident visually) in the model’s behavior. (D) shows that varying the delay τC (in a similar way to that shown in Figure S5 in Supplementary Material), rather than the naive CD8+ T cell number, does not alter the exponential relationship. In (D), the crosses represent the results of varying τC and the empty circles are the same as those in (C) for comparison.

