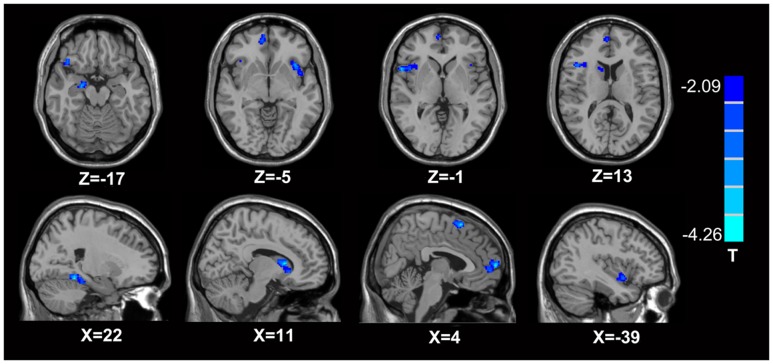
FIGURE 1.
Brain areas exhibiting significantly lower AK values in MTrPs subjects compared to healthy controls. The blue zone represents the brain areas with decreased AK values (p < 0.05, correction). The colored stripe on the right represents the T-value. The left side of the figure represents the anatomical right side, and vice versa. MTrPs, myofascial trigger points; AK, axial kurtosis.

