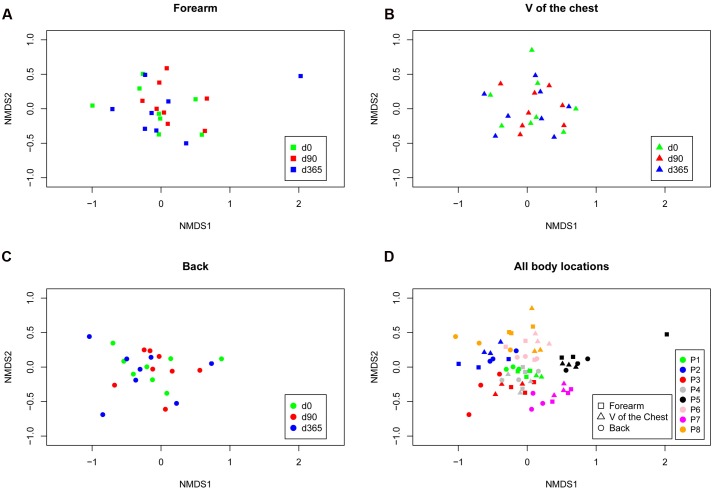
FIGURE 2.
Non-metric ordination plots based on Bray–Curtis distances for each body location forearm (A), V of the chest (B) and back (C) colored according to the storage period and for all locations (separated by symbols) and storage periods combined colored by the volunteer (P1–P8; D). Neither calculating each body location individually nor analyzing all locations together revealed a cluster for storage time at -80°C. The clustering occured in inter-individual differences [patient p-value = 0.001 (R2 = 49%), body location p-value = 0.023 (R2 = 4.7%), and storage time p-value = 0.07 (R2 = 4.0%) as analyzed with multivariate permutational MANOVA; Adonis in R.

