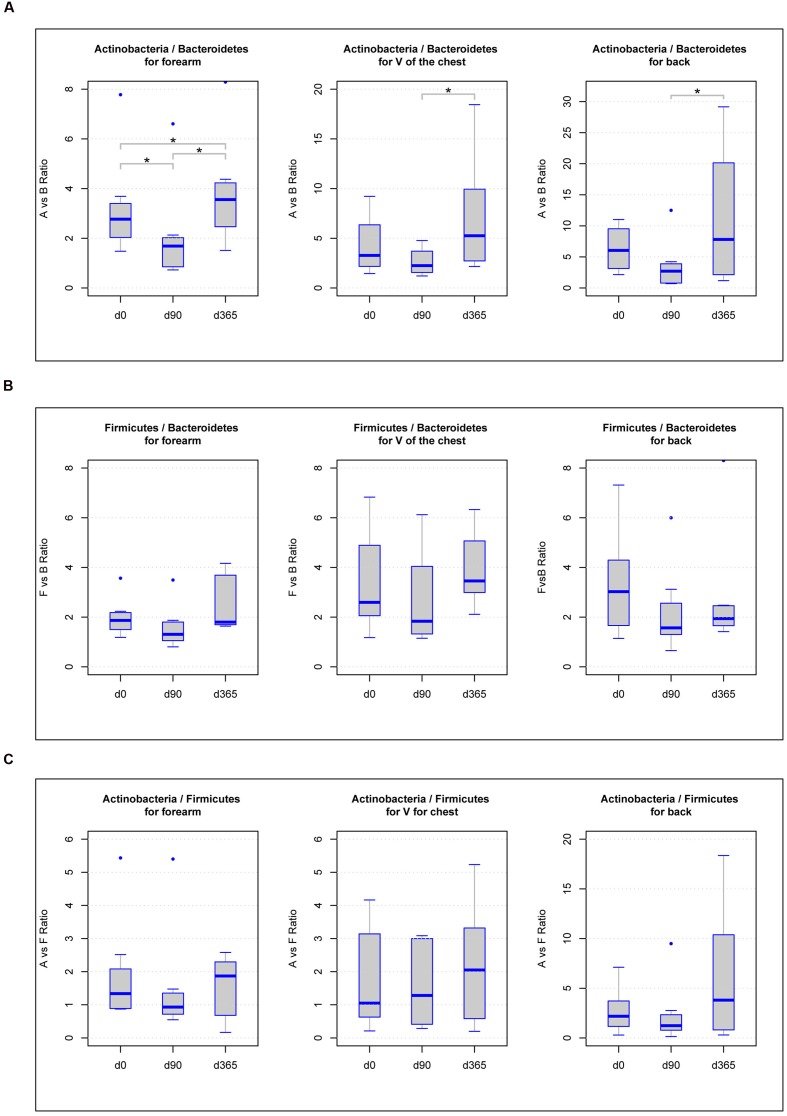
FIGURE 4.
Boxplot diagram of the ratios of the three main phyla Actinobacteria vs. Bacteroidetes (A), Firmicutes vs. Bacteroidetes (B), and Actinobacteria vs. Firmicutes (C) in forearm, V of the chest and back samples: significant differences in the phyla ratios between storage periods at -80°C (p-value below 0.05) are marked with a line between the affected sample groups and an asterisk.

