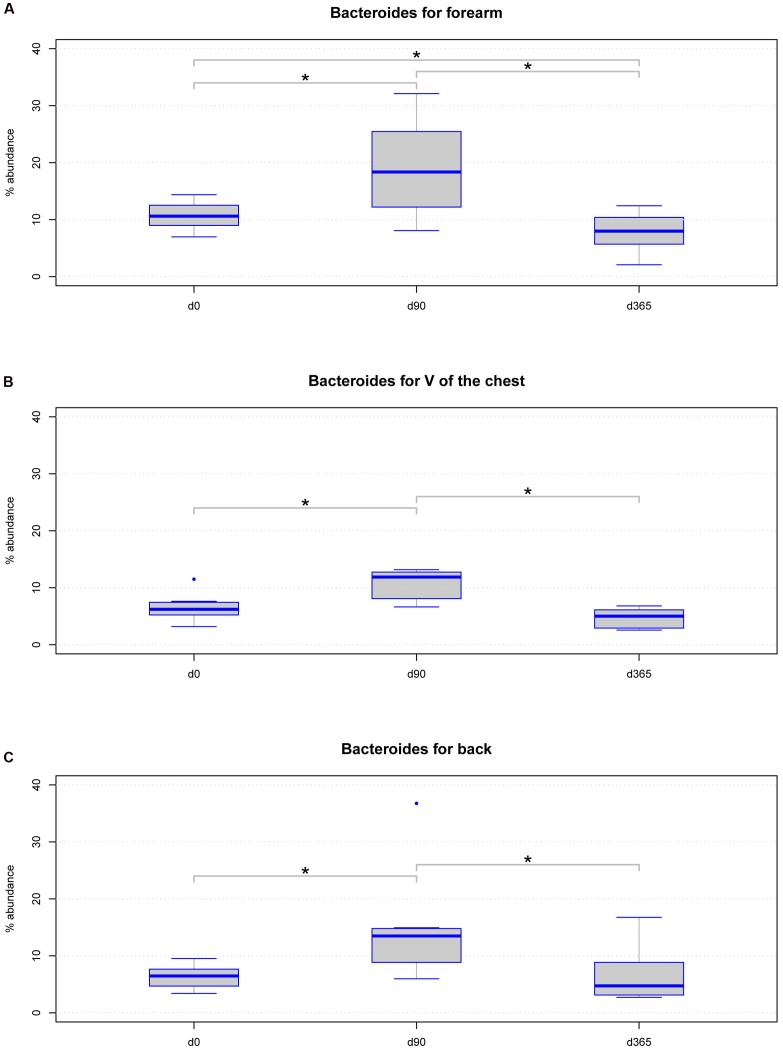
FIGURE 6.
Boxplot diagram for the relative abundance of the genus Bacteroides: this genus is significantly changed in samples from the three body locations (A) forearm (p-value = 0.00033), (B) V of the chest (p-value = 0.00463), and (C) back (p-value = 0.0098) regarding the storage period using the Friedman statistical test. Significant differences (p-value below 0.05) are marked with a line between the affected sample groups and an asterisk.

