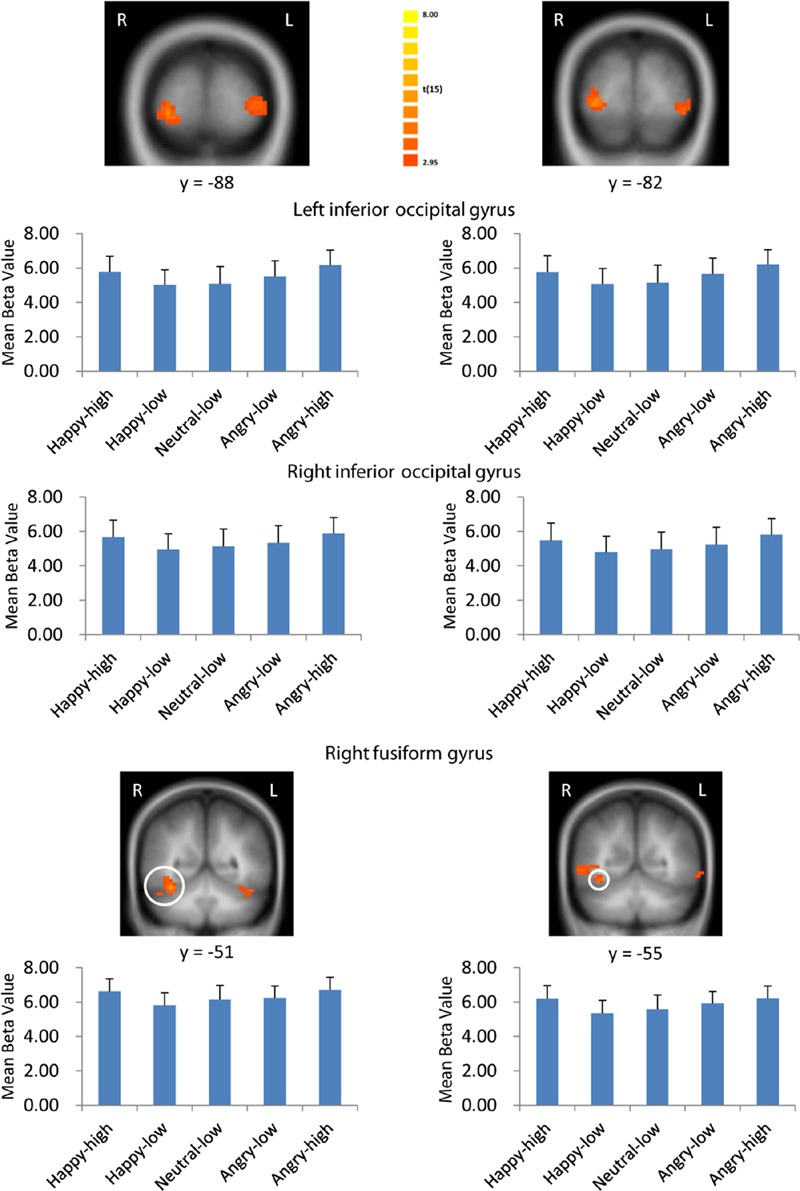
FIGURE 3.

Visual activation to high intensity as compared to low intensity emotional facial expressions and to the neutral expression. Larger activation was found with both the general approach (left column) and the approach based on normative arousal ratings (right column) in inferior occipital gyrus and fusiform gyrus. The plots display contrasts of parameter estimates (mean ± SE for local cluster peaks). Radiological convention: left = right.
