Figure 2.
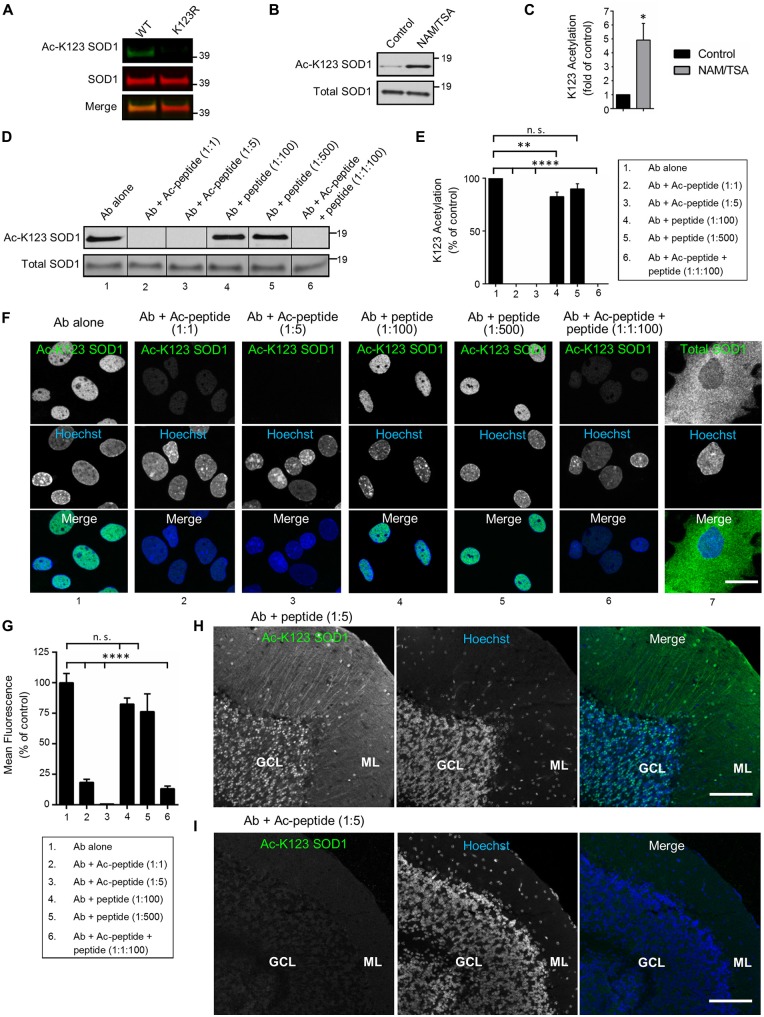
Antibodies are specific for K123-acetylated SOD1. (A) Infrared fluorescence western blot analysis of transfected HEK293 cells expressing SOD1 WT-EGFP or SOD1 K123R-EGFP. Ac-K123 SOD1 (R26) rabbit polyclonal antibody was detected by goat anti-rabbit IRDye 800CW (shown in green) and SOD1 (G-11) mouse monoclonal antibody was detected by goat anti-mouse IRDye 680LT antibodies (shown in red). (B) Enhanced chemiluminescence (ECL) western blot of lysates from HEK293 cells (pretreated for 6 h with DMSO vehicle control or nicotinamide (NAM)/trichostatin A (TSA)) probed with Ac-K123 SOD1 rabbit polyclonal or SOD1 (G-11) mouse monoclonal antibodies. Protein bands were detected by ECL. (C) Bar graph of quantification for Ac-K123 SOD1 densitometry normalized to SOD1. The acetylation level of NAM/TSA treated cells are plotted relative to vehicle control cells (n = 3, *significance at P < 0.05 by Student’s t-test). (D) Western blot analysis of protein extracts isolated from NAM/TSA treated HEK293 cells probed with Ac-K123 SOD1 (R26) antibody that was pre-incubated with either no peptide, Ac-peptide (1:1 or 1:5 molar ratio), unmodified peptide (1:100 or 1:500) or a mixture of Ac-peptide and unacetylated peptide (1:1:100). (E) Quantification of the antibody preabsorption western blot results. Ac-K123 SOD1 band intensities were normalized to those of SOD1 and plotted as percentage of K123 acetylation relative to the antibody alone (n = 3, **and significance at P < 0.01 and P < 0.0001 by ANOVA, respectively). (F) Confocal micrographs (scale bar, 20 μm) of primary spinal cord astrocytes immunostained with Ac-K123 SOD1 (R26) antibody that was pre-incubated with either no peptide, Ac-peptide, unacetylated peptide or a mixture of Ac-peptide and unacetylated peptide (the same molar rations as in 2D); or a commercial antibody for total SOD1. Hoechst 33342 nuclear labeling and merged images are also shown. (G) Quantification of antibody preabsorption immunocytochemistry results. Data are reported as percentage of nuclear mean fluorescence intensity relative to the antibody alone control of 150 (antibody alone), 100 (Ab + Ac-peptide 1:1), 100 (Ab + Ac-peptide 1:5), 100 (Ab + unacetylated peptide 1:100), 100 (Ab + unacetylated peptide 1:500) and 100 (Ab + Ac-peptide 1:1 + unacetylated peptide 1:100) astrocytes in three independent experiments (****significance at P < 0.0001 by ANOVA). (H) Confocal micrograph (scale bar, 100 μm) of cerebellum immunostained with Ac-K123 SOD1 (R26) antibody pre-incubated with unacetylated peptide at 1:5 molar ratio prior to immunohistochemistry. GCL, granular cell layer; ML, molecular layer. (I) Confocal micrograph (scale bar, 100 μm) of cerebellum immunostained with Ac-K123 SOD1 (R26) antibody preabsorbed with Ac-peptide at 1:5 molar ratio prior to immunohistochemistry. GCL, granular cell layer; ML, molecular layer.

