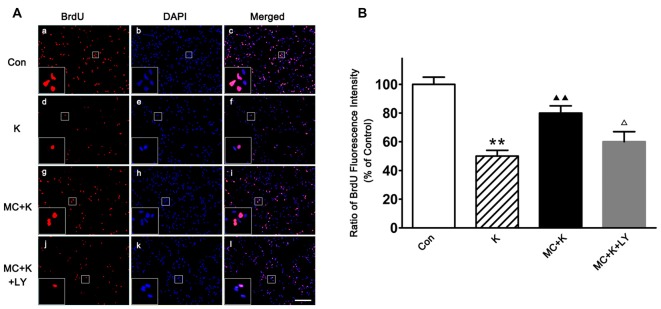
Figure 4.
Effect of MC on NSC proliferation by 5-Bromo-2′-deoxyuridine (BrdU) incorporation assay. (A) Representative immunofluorescence images of BrdU positive cells in the four groups. Cells were stained for BrdU (red) and DAPI for the nucleus (blue). Scale bar = 50 μm. (B) Quantitative analysis of BrdU staining in the experimental groups. Dates are the mean ± SEM of three independent experiments (n = 6 for each group); **P < 0.01 vs. control; ▲▲P < 0.01 vs. ketamine; ΔP < 0.05 vs. ketamine plus MC.

