
Figure 6.
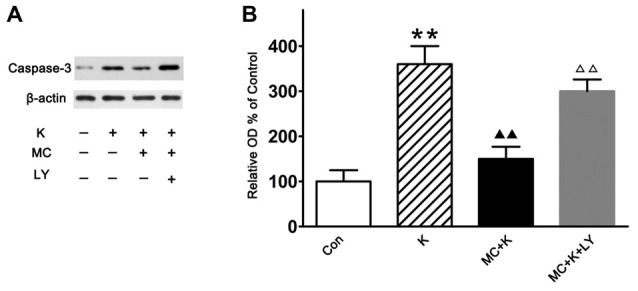
Western blot analysis of the caspase-3 expression. (A) Representative images of the caspase-3 and β-actin expression by western blot in the four groups. (B) Quantitative analysis of caspase-3 expressions normalized to β-actin. Data were expressed as the ratio to OD values of the corresponding controls and showed as the mean ± SEM of three independent experiments (n = 6 for each group); **P < 0.01 vs. control; ▲▲P < 0.01 vs. ketamine; ΔΔP < 0.01 vs. ketamine plus MC.