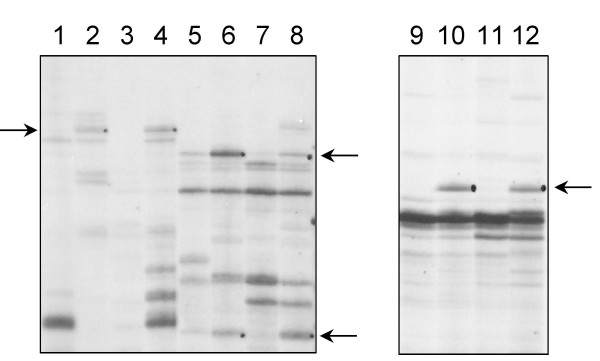
Figure 3.

Zoom in on an auto-radiogram of differentially displayed RT-PCR products. The RT-PCR were performed with primers 5'T11GA and 5'GATCTAACCG (lane 1 to 4), primers 5'T11GA and 5'GATCAATCGC (lane 5 to 8), primers 5'T11GA and 5'TACAACGAGG (lanes 9 to 12). Uneven lanes: H2O treated plants. Even lanes: 10 μM BTH treated plants. The arrows show bands corresponding to transcripts accumulating only or presenting a higher expression in BTH treated plants.
