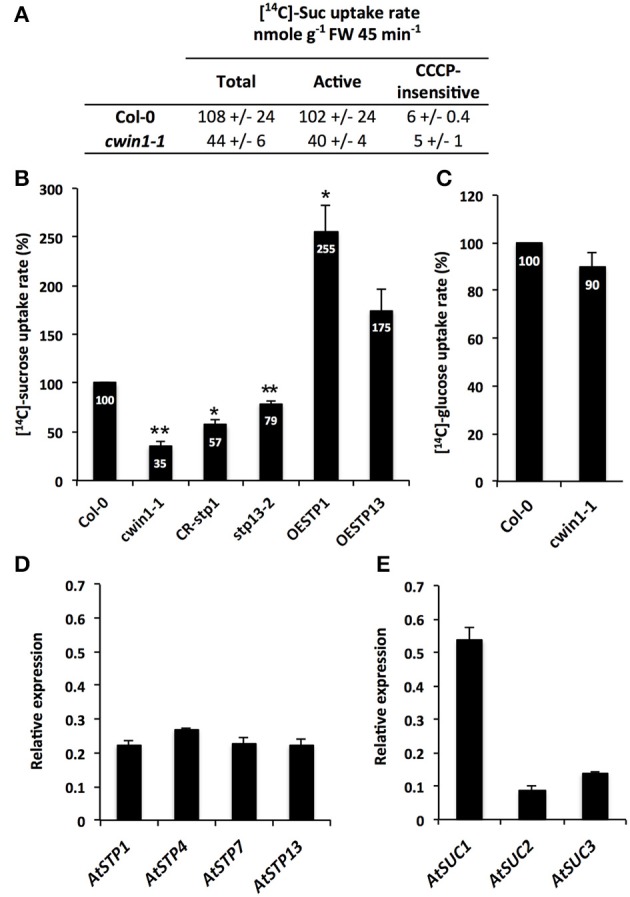
Figure 2.

Sucrose uptake activity and gene expression in seedling roots. (A) [14C]-sucrose uptake activity in 9-day-old Col-0 and cwin1-1 seedling roots grown with 2% sucrose (mean +/− SE of 2 independent experiments). Active sucrose uptake results from the difference between total and CCCP-insensitive uptakes (B) Relative [14C]-sucrose uptake rate in 9-day-old seedling roots of cwin1-1, CR-stp1, stp13-2, OESTP1, and OESTP13 lines grown with 2% sucrose. Results are relative to the Col-0 uptake rate and represent mean (±SE) of at least 3 independent experiments. (C) Relative [14C]-glucose uptake activity in 9-day-old seedling roots of Col-0 and cwin1-1 lines. Results are relative to the Col-0 uptake rate and represent mean (±SE) of 3 independent experiments. (D,E) Expression of the 14 AtSTP (D) and 9 AtSUC (E) genes in 9-day-old Arabidopsis seedling roots. Genes that were expressed below the detection level are not presented. Gene expression analysis was performed by RT-qPCR and results were normalized to the plant reference genes At4g26410 and AtACTIN2 (At3g18780). Data represent mean (±SE) of 3 independent experiments. For (B) and (C), asterisks represent significant differences compared to Col-0 plants (Student's t-test, *P < 0.05; **P < 0.01).
