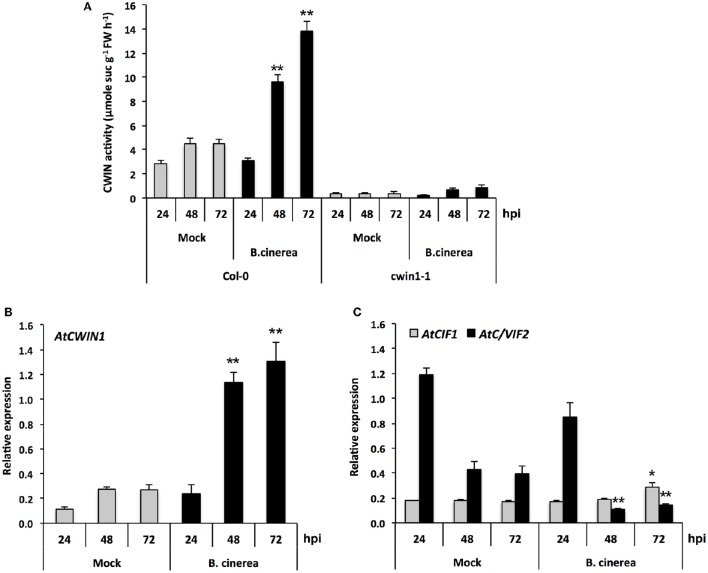
Figure 4.
CWIN activity and expression of AtCWIN1, AtCIF1, and AtC/VIF2 genes in response to B. cinerea infection. (A) CWIN activity in Mock and B. cinerea (5 × 10⁴ conidia ml−1) treated leaves of Col-0 and cwin1-1 plants. Data represent mean (±SE) of at least 3 independent experiments. Relative expression of AtCWIN1 (B), AtCIF1, and AtC/VIF2 (C) was performed by RT-qPCR in Mock and B. cinerea (5 × 10⁴ conidia ml−1) treated leaves of wild type plants. Gene expression was normalized to the plant reference genes At4g26410 and AtACTIN2 (At3g18780). Data represent mean (±SE) of at least 3 independent experiments for each condition. Asterisks represent significant differences compared to the corresponding Mock condition (Student's t-test, *P < 0.05; **P < 0.01).

