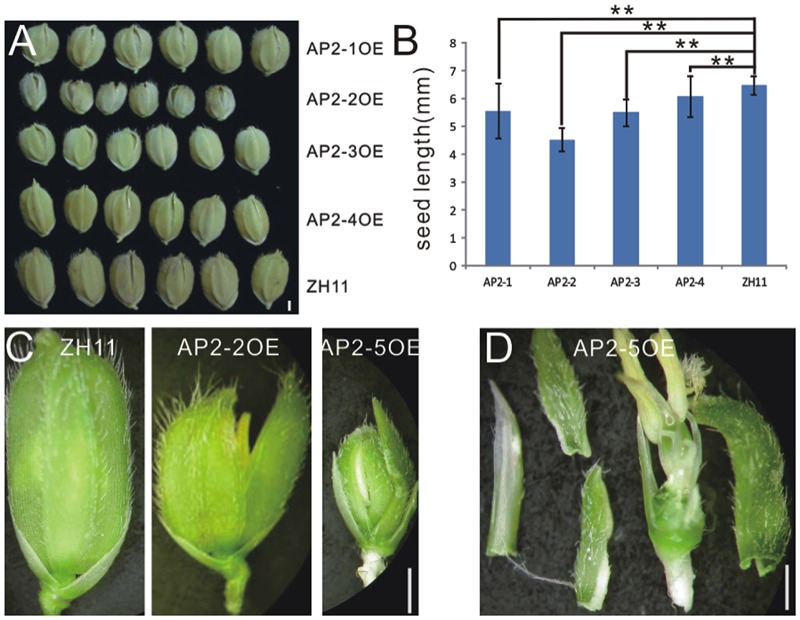
FIGURE 3.

Phenotypes in the grain and spikelet of AP2s overexpressing plants. (A) Grains of the AP2OEs plants. Bar was 1 mm. (B) The grain length of the AP2OEs. Double asterisks represent significant difference determined by the Student’s t-test at ∗∗P < 0.01, respectively. (C) Spikelet of ZH11, AP2-2OE, and AP2-5OE plants. (D) Dissection of a spikelet of the AP2-5OE plant. Bars in (C,D) were 1 mm.
