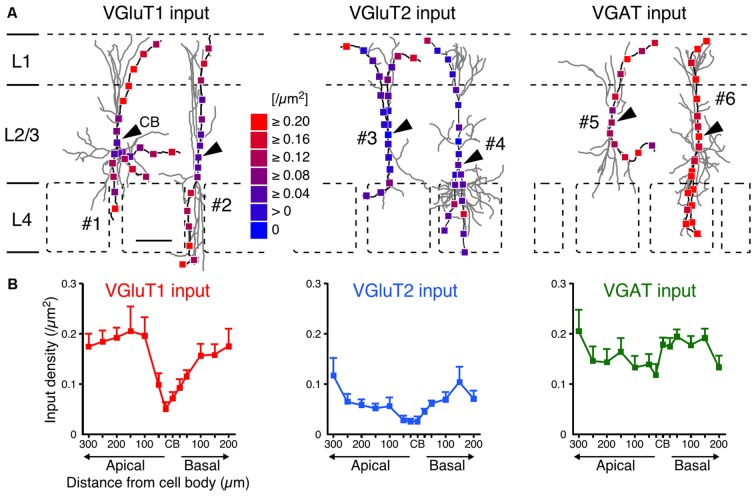
Figure 5.
VGluT1, VGluT2 and VGAT input densities to L2/3 VIP+ neurons. (A) Examples of VGluT1 (left), VGluT2 (middle) and VGAT inputs (right). Arrowheads indicate CB #1–6 correspond to #1–6 in Figure 2A. Scale bar = 100 μm. (B) VGluT1, VGluT2 and VGAT input densities are plotted as a function of distance along the apical and basal branches. To calculate the input densities to VIP+ neurons, we counted the number of input sites and divided them by the surface areas. VGluT1 inputs were more frequently observed in the distal dendrites than in the somata (left). VGluT2 inputs (middle) also increased from the somata to the distal dendrites, but VGluT2 input density was less than half of VGluT1 input density. VGAT input density, on the other hand, did not significantly differ among distances from the somata (right). Input densities were not significantly different between the apical and basal branches at equivalent distances from the somata. Error bars, ± SEM.

