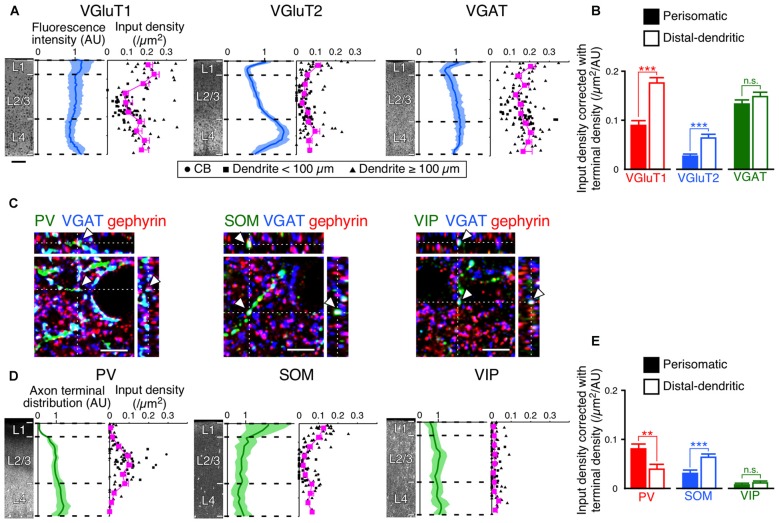
Figure 8.
Input densities corrected with total densities of axon terminals. (A) VGluT1-, VGluT2- and VGAT-immunofluorescence intensities across layers are shown in blue (mean ± SD), where each mean intensity value across layers from the pia mater to the white matter was standardized as 1 arbitrary unit (AU). Scatter diagrams show input densities and cortical depths (black). The cortical depth from L1 to L4 is divided into 10 bins, and the mean input densities are plotted (magenta). Scale bar = 100 μm (also applied to D). (B) VGluT1, VGluT2 and VGAT input densities corrected with axon terminal intensities. The input densities were divided by the axon terminal intensities at equivalent cortical depths. VGluT1 input, p < 0.0001; VGluT2 input, p < 0.0001; VGAT input, p = 0.1485 using two-tailed Student’s t-test. Six neurons from three mice for each input. (C) PV-, SOM-, and VIP-positive axon terminals. PV-, SOM- or VIP-immunoreactive puncta were regarded as axon terminals only when the puncta were also positive for VGAT. The double-positive puncta apposing gephyrin-immunoreactive dots were counted to determine axon terminal densities (arrowheads). Scale bars = 5 μm. (D) PV-, SOM- and VIP-positive axon terminal densities across layers are shown in green (mean ± SD), where each mean density value across layers from the pia mater to the white matter was standardized as 1 AU. Scatter diagrams show input densities and cortical depths (black). The cortical depth from L1 to L4 is divided into 10 bins, and the mean input densities are plotted (magenta). (E) PV, SOM and VIP input densities corrected with axon terminal densities. The input densities were divided by the axon terminal densities at equivalent cortical depths. PV input, p = 0.001; SOM input, p < 0.0001; VIP input, p = 0.2155 using two-tailed Student’s t-test. Error bars, ± SEM. **p < 0.01; ***p < 0.001; n.s., not significant.

