
Figure 9.
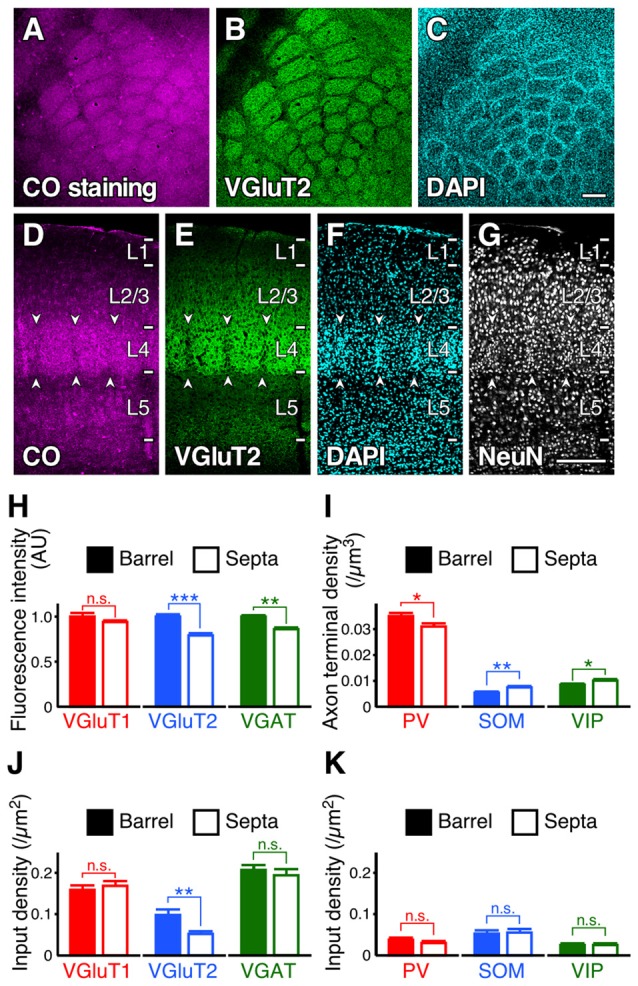
Input densities to L2/3 VIP+ neuron dendrites in barrels and septa of L4. (A–G) Tangential and coronal sections with CO-fluorescence staining (A,D), immunofluorescence staining for VGluT2 (B, E) and NeuN (G), and DAPI counterstaining (C,F). Barrels and septa could be identified through comparison with VGluT2 immunofluorescence and DAPI counterstaining. Arrowheads indicate septa. Scale bars = 200 μm. (H,I) Immunofluorescence intensities (H) and axon terminal densities (I) in barrels and septa. Mean immunofluorescence intensities in barrels were standardized as 1 AU (H). VGluT1, p = 0.244; VGluT2, p < 0.0001; VGAT, p = 0.002; PV, p = 0.0361; SOM, p = 0.0097; VIP, p = 0.0495; nine observed regions of the centers of barrels or septa for each axon terminal from three mice using two-tailed Student’s t-test. (J,K) Input densities onto the dendrites in barrels and septa (~30 dendrites from three mice for each input). VGluT1 input, p = 0.5388; VGluT2, p = 0.0026; VGAT, p = 0.5047; PV, p = 0.2814; SOM, p = 0.8237; VIP, p = 0.7617 from three mice using two-tailed Student’s t-test. Error bars, ± SEM. *p < 0.05; **p < 0.01; ***p < 0.001; n.s., not significant.